
US DOLLAR FORECAST: DXY INDEX TOPS 100 AS USD PRICE ACTION EXTENDS HIGHER DESPITE FED ACTION
- The US Dollar extends higher with USD price action on pace for the largest back-to-back weekly gain since March 2015
- US Dollar funding pressure seems to persist despite monetary stimulus efforts from the Fed as economic costs from the coronavirus pandemic mounts
- The DXY Index explodes past the 100.00 handle amid a breakdown in EUR/USD and GBP/USD while USD/CAD and USD/JPY climb
The DXY Index, a basket of major currency pairs reflecting broad performance in the US Dollar, soared past the 100.00 mark on Wednesday. The recent rally in USD price action, which comes in spite of aggressive intervention from the Federal Reserve, has pushed the DXY Index to its highest level since April 2017.
DXY INDEX – US DOLLAR PRICE CHART: WEEKLY TIME FRAME (NOVEMBER 2016 TO MARCH 2020)
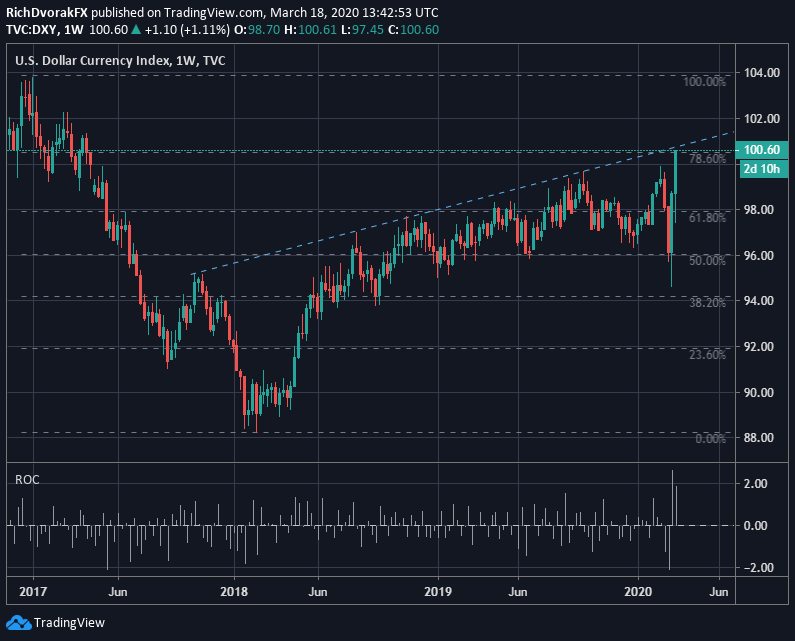
Chart created by @RichDvorakFX with TradingView
The DXY Index is now up over 6% since its March 09 intraday swing low, which sets the US Dollar rally over the last two weeks at its fastest pace in five years. I noted in yesterday’s US Dollar forecast how the ongoing ascent in the US Dollar and DXY Index Is likely attributed to widespread risk aversion, which tends to fuel demand for safe-haven currencies such as the USD. This comes amid comes amid deepening coronavirus woes.

USD price action could be running into technical resistance, however, as highlighted by the 78.6% Fibonacci retracement level of the January 2017 to February 2018 bearish leg etched out by the DXY Index. Another technical barrier with potential to steer the DXY Index lower is underpinned by the upward-slowing resistance trendline extended through the series of higher highs since October 2017.
USD PRICE OUTLOOK – US DOLLAR IMPLIED VOLATLITY & TRADING RANGES (OVERNIGHT)
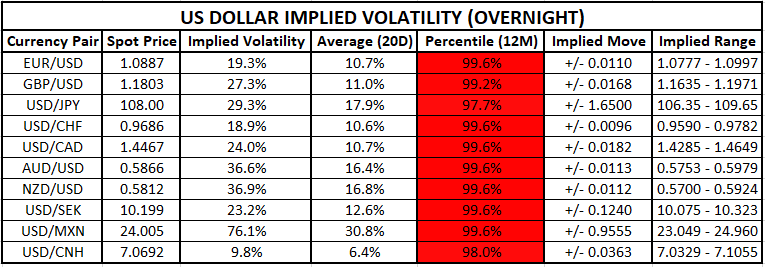
Nevertheless, prevailing fundamental forces – like the return of FX volatility and liquidity pressure amid this funding market distress signal – might continue domineering over USD price action and the direction of the broader US Dollar Index. On that note, metrics reflecting expected FX volatility exploded even higher despite already being at extreme levels.

This is judging by overnight implied volatility readings on the US Dollar and select peers. I fact, EUR/USD overnight implied volatility skyrocketed to 19.3%, which is the highest reading since April 2017. Options-implied trading ranges are calculated using 1-standard deviation (i.e. 68% statistical probability price action is contained within the implied trading range over the specified time frame).
Keep Reading: FX Volatility Will Oscillate, but the High Vol Regime is Here to Stay
-- Written by Rich Dvorak, Junior Analyst for DailyFX.com
Connect with @RichDvorakFX on Twitter for real-time market insight