


USD FORECAST: US DOLLAR EYES DECEMBER ADVANCED RETAIL SALES DATA DUE FOR RELEASE FOLLOWING TRUMP TRADE DEAL SIGNING CEREMONY WITH CHINA
- USD prices drifted to the downside during Wednesday’s session while risk assets soared as markets rejoiced the US-China trade agreement signing ceremony
- The US Dollar could remain under pressure owing to the lack of safe-haven demand with trade relations between Washington and Beijing growing brighter with their phase one trade deal
- The Fed keeping its printing press greased up and running could keep weighing negatively on the US Dollar, but advanced retail sales data expected Thursday could strongarm USD price action
USD prices came under pressure throughout Wednesday’s trading session which pushed the DXY Index – a popular benchmark of major currency pairs reflecting broader performance in the US Dollar – approximately 0.15% lower to the 97.25 mark.
One possible explanation for weakness in USD price action could be the absence of demand for safe-haven currencies like the US Dollar, which likely results from an abundance of risk appetite stemming from President Trump’s official signing ceremony of his phase one trade agreement brokered with China.
US DOLLAR INDEX PRICE CHART: DAILY TIME FRAME (JUNE 2019 TO JANUARY 2020)
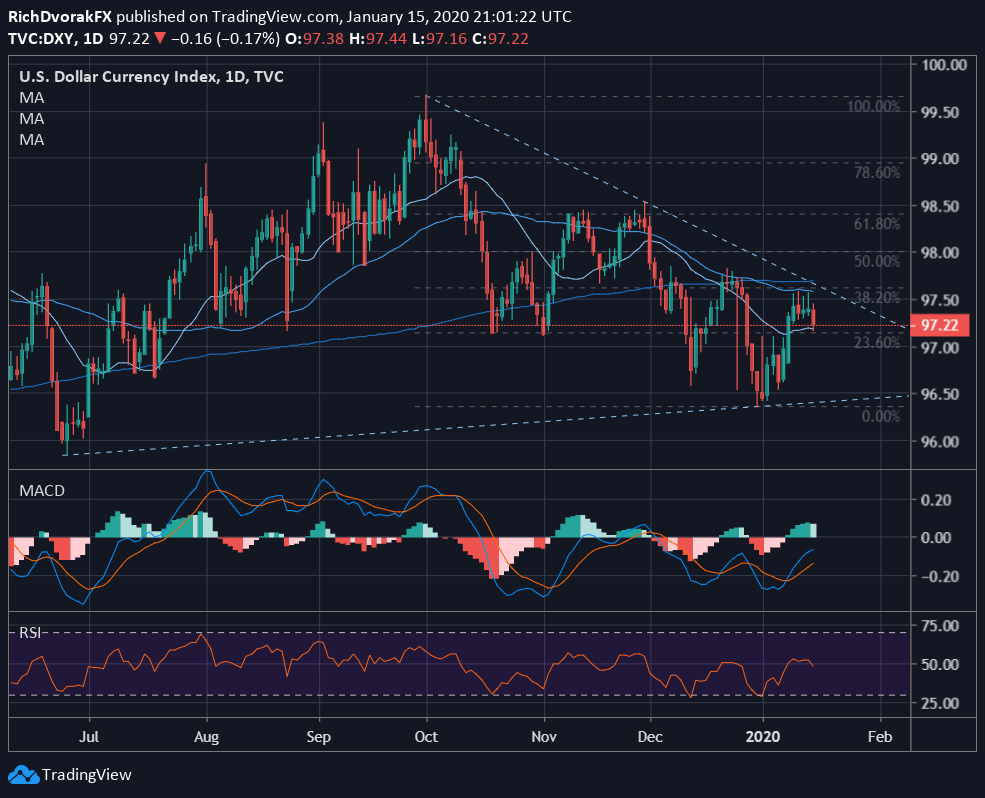
Chart created by @RichDvorakFX with TradingView
From a technical perspective, another rejection at confluent resistance near the 97.50 price level – underscored by the 50-day simple moving average the 38.2% Fibonacci retracement of the October 03 swing high recorded by the US Dollar Index – can also explain weakness in USD price action.
The US Dollar is now testing technical support potentially provided by its 20-day simple moving average and 23.6% Fibonacci retracement level, which rest slightly above the 97.00 handle. Potential for further downside in USD prices and retest of the December 31 swing low is noteworthy if the aforementioned area of technical support fails to keep the US Dollar afloat.
Shifting gears to focus on fundamental catalysts that may steer the general direction of USD price action, we find that the latest release of US advanced retail sales data is expected to cross the wires Thursday, January 16 at 13:30 GMT. A detailed list of scheduled data releases and event risk that impact the US Dollar can be found at the DailyFX Economic Calendar.
CHART OF US ADVANCED RETAIL SALES HISTORICAL DATA (JUNE 2015 TO DECEMBER 2019)
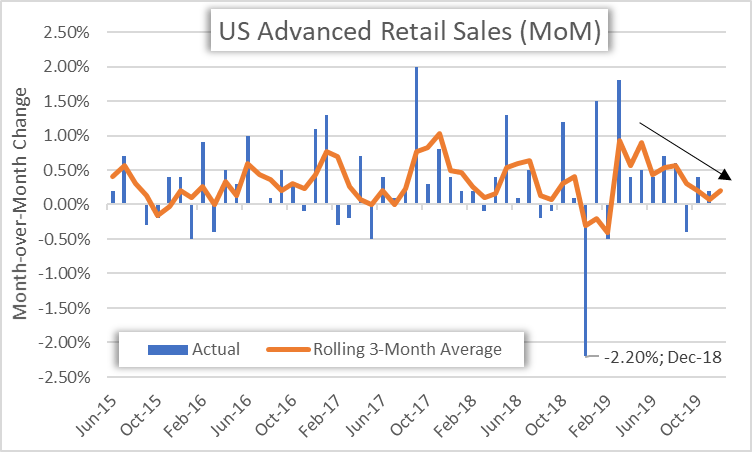
The US retail sales report could send USD rates spiraling lower if the data reveals that American consumers were feeling stingy this holiday shopping season and decided not to spend big. This is because the strength of the US economy is determined overwhelmingly by personal consumption expenditures.
Sustained sluggishness in retail sales growth might raise a red flag at the Federal Reserve and prompt forex traders to ramp up expectations for further accommodation from the FOMC. The US Dollar would likely be dragged lower in turn.
Another fundamental force dragging USD price action lower could be the persistence of daily liquidity injections from the Fed via its repo operations, which has inflated the central bank’s balance sheet by an alarming $400 billion since this past September.

Correspondingly, this increases the supply of USD circulating the financial system and could have, in part, contributed to the US Dollar Index’s 2.5% drift lower from last year’s peak. On that note, the New York Fed announced yesterday that it intends to keep the easy-money printing press on according to its latest repo operations schedule.
Specifically, the FOMC will continue to conduct overnight repo operations every business day with an aggregate limit of $120 billion until mid-February, which is in addition to 14-day term repos offered twice a week with an aggregate limit of $35 billion through month-end and $30 billion through next month.
Keep Reading – US Dollar Forecast: USD Charts & Levels to Watch This Week
-- Written by Rich Dvorak, Junior Analyst for DailyFX.com
Connect with @RichDvorakFX on Twitter for real-time market insight


