


USD FORECAST: US DOLLAR CHARTS TEST RESISTANCE – WATCH DXY, EUR/USD, GBP/USD, USD/JPY & USD/CNH THIS WEEK
- The US Dollar Index is testing a key technical resistance level as USD price action attempts to reverse its recent downtrend after trading roughly 1% higher so far this year
- GBP/USD is expected to be the most active major currency pair judging by its 1-week implied volatility reading of 6.88% and compares to EUR/USD 1-week implied volatility of 3.96%
- USD/CNH 1-week implied volatility is perking up in light of event risk surrounding the expected US-China phase one trade deal signing between President Trump and Vice Premier Liu He
USD price action is off to a strong start to 2020 with the US Dollar on pace for a 1% gain year-to-date. Though the Greenback could soon come under pressure as the US Dollar approaches a series of technical resistance levels with potential of thwarting a sustained rebound in the DXY Index off a 5-month low.
DXY – US DOLLAR INDEX PRICE CHART: DAILY TIME FRAME (JULY 2019 TO JANUARY 2020)
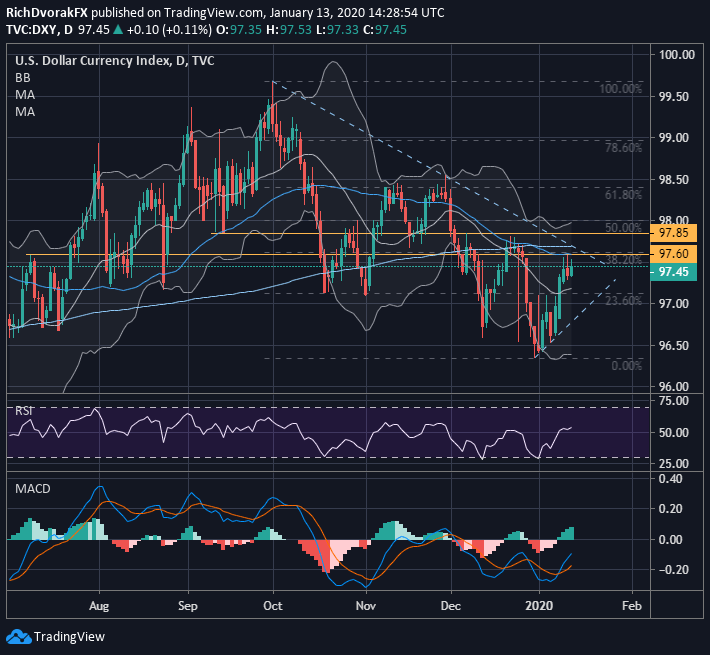
Chart created by @RichDvorakFX with TradingView
The US Dollar Index is currently trading at the 97.45 mark after struggling to eclipse a zone of confluence around the 97.50-60 price level. This area of technical resistance is highlighted by the 50-DMA and 38.2% Fibonacci retracement of its recent swing high printed this past October.
Further underscoring nearside obstacles faced by USD price action is the 200-DMA and the downward-sloping trendline connecting the October 01 and November 29 intraday highs on the DXY Index.
USD – US DOLLAR IMPLIED VOLATILITY & TRADING RANGES (1-WEEK)
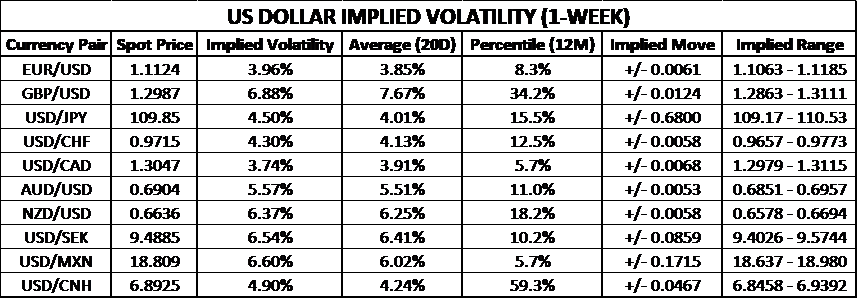
Learn More: How to Trade the Top 10 Most Volatile Currency Pairs
As for scheduled event risk with potential to weigh on the US Dollar this week, forex traders will likely turn to the release of high-impact economic indicators for fundamental catalysts to steer the direction of USD and the broader DXY Index.
On that note, the latest consumer price index (CPI) release is due Tuesday, January 14 at 13:30 GMT while advanced retail sales data for December is anticipated to cross the wires Thursday, January 16 at 13:30 GMT – detailed on the DailyFX Economic Calendar.
Additionally, the New York Fed – a district bank of the Federal Reserve with the sole responsibility of conducting the central bank’s open market operations – is expected to publish an update to its repo operations schedule on Tuesday, January 14.

The Fed has inflated its balance sheet by over $400 billion since August and increases the US Dollar supply circulating the financial system. A sustained flood of cash from the Federal Reserve via repo operations deeper into the new year threatens to continue serving as a major headwind to USD price action.
SPOT USD/CNH – US DOLLAR TO CHINESE YUAN PRICE CHART AT LOWEST LEVEL SINCE JULY 2019

Chart created by @RichDvorakFX with TradingView
Another key fundamental theme to watch this week that has strong potential to drive the US Dollar is an expected signing of the phase one trade deal between the US and China this Wednesday, January 15 at the White House.
Since the onset of the US-China trade war in 2Q-2018, the DXY US Dollar Index has closely tracked the direction of spot USD/CNH with a generally positive correlation. The Chinese Yuan has appreciated roughly 4.5% against the US Dollar since Sino-American trade tensions seemingly peaked this past September.

Owing to the prospect of lower tariffs on Chinese exports into the United States levied by President Trump, spot USD/CNH has since sunk back below the 6.9000 handle for the first time since July 31. That said, weakness in the US Dollar and DXY Index could linger if US-China trade relations improve further and spot USD/CNH continues to weaken.
USD – US DOLLAR RISK REVERSALS (1-WEEK)
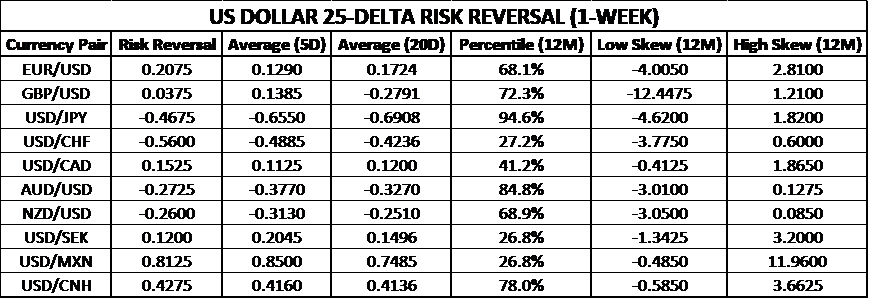
A risk reversal reflects the skew in demand between out-of-the-money call and put options and is quantified by the implied volatility for call options less implied volatility for put options. In other words, a higher risk reversal reading indicates that OTM call options are in greater demand than OTM put options for a given underlying asset.
That said, currency options traders have a bullish bias toward spot USD/CNH judging by its latest 1-week risk reversal reading of 0.4275, which likely reflects uncertainty around US-China trade relations subsequent to the signing of the phase one trade agreement and potential risk of a last-minute breakdown in talks.
Likewise, the positive 1-week risk reversal reading for USD/CAD at 0.1525 suggests that forex options traders anticipate higher spot prices over the next 5 trading days. Though this is a bit peculiar considering the recent Canadian Employment Report smashed market expectations while US Nonfarm Payrolls (NFP) disappointed.
| Change in | Longs | Shorts | OI |
| Daily | 5% | -8% | -5% |
| Weekly | -5% | 1% | -1% |
In contrast, 1-week for USD/JPY EUR/USD, GBP/USD at -0.4675, 0.2075 and 0.0375 respectively hints at a weaker USD prices for these major US Dollar currency pairs. As for USD/JPY, the US Dollar is hitting a 7-month peak against the Japanese Yen, but spot prices could come under pressure if technical resistance presented by the 110.00 handle hinders further upside.
Meanwhile, EUR/USD price action seems to be holding the 1.1100 level and finding technical support provided byits upward-sloping trendline extended through the November 29 and January 10 intraday lows as a bullish “golden cross” of its 50-DMA and 200-DMA takes shape.
| Change in | Longs | Shorts | OI |
| Daily | -4% | -11% | -6% |
| Weekly | 9% | -17% | -1% |
Last but not least, spot GBP/USD is currently testing confluent resistance-turned-support around the 1.29-1.30 price zone as the Pound Sterling continues to slide from its post- UK Election results peak. Most recent downside in GBP/USD prices can be attributed primarily to dovish rhetoric from members of the BOE Monetary Policy Committee and disappointing UK economic data released earlier today.
Keep Reading: Central Bank Watch – New Year, Old Policies: Maintain the Path on Interest Rates
-- Written by Rich Dvorak, Junior Analyst for DailyFX.com
Connect with @RichDvorakFX on Twitter for real-time market insight


