


US Dollar, Dow Jones, & US-China Phase One Trade Deal Talking Points:
- Stock market indices hit fresh record highs this morning in the runup to the phase one trade deal signing ceremony between US President Trump and Chinese Vice Premier Liu He
- Elements of the trade deal include forced technology transfers, currency manipulation and commitments from China to make large purchases of US agricultural goods
- Tariffs on $250 billion of goods exported into the United States from China will remain in place during a 10-month compliance review period and until a phase-two trade deal is reached
Details from the text of the trade agreement, released shortly after the signing of the pact include agreements for China to step up their purchases of agricultural and energy products from the United States, along with stiffer intellectual property rules. Currency manipulation, tech transfers, and financial services were also key components listed in the text of the agreement.
China has also vowed to further open their country to investment to the outside world, something they have struggled with in recent history.
It was noted that China will allow full foreign ownership of entities by April 01, 2020 and that electronic payment processers domiciled in the US such as Visa, Mastercard and American Express. Also, China is expected to approve a pending application for US bond raters allowing them to tap into China's whopping $14 trillion debt market.
For agricultural purchases, China has agreed to ensure that agricultural goods will be bought in specific quantitiesover the next two years through the end of 2021. Specifically, China agrees to buy an additional $19.5 billion in US agricultural products in 2021 and $12.5 billion this year with Chinese purchasers striving to buy an additional $5 billion of farm goods per year.
China's purchases of energy products will also be increased an additional $33.9 billion in 2021 and include oil, coal and liquid natural gas goods.
Furthermore, while the phase one trade deal between the US and China contained broad goals for protecting intellectual property on pharmaceutical goods, no specific rules were stated.
Enforcement mechanisms to ensure compliance between the two countries allows for tariffs and other retaliatory measures to be put in place if either side break provisions of the agreement. Additionally, in a move to seemingly prevent further tit-for-tat escalation, the agreement allows a side to be immune from retaliation if they believe they were acting in good faith.
If the United States or China is believed to have "acted in bad faith" and fails to comply with the phase one deal, the complaining party can exit the agreement by providing written notice of withdrawal.
DJIA – DOW JONES PRICE CHART: DAILY TIME FRAME (JULY 2019 TO JANUARY 2020)
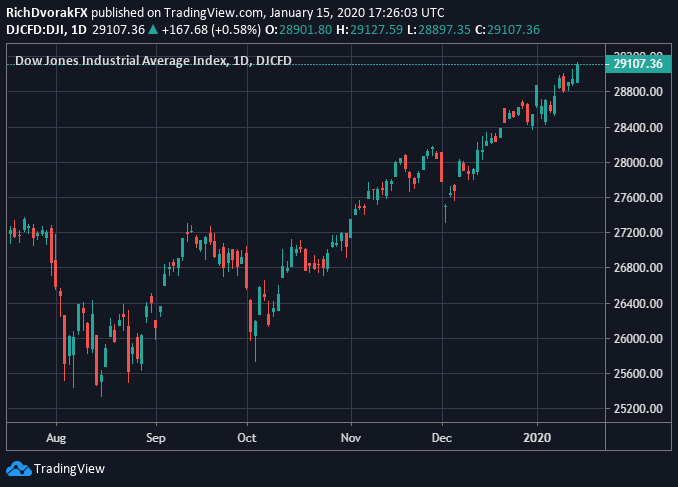
Chart created by @RichDvorakFX with TradingView
The Dow Jones Industrial Average (DJIA) ramped higher to top the 29,100 price level in the minutes leading up to the US-China phase one trade deal signing ceremony. The Dow is up well over 10% since President Trump and Chinese Vice Premier Liu He first announced the positive breakthrough on Sino-American trade relations.

Likewise, the S&P 500 Index is up 15% from its October 2019 swing low and continues to print fresh record-highs almost daily. Optimism exhibited by equity investors surrounding the partial trade deal has helped steer small-cap and EM stock market benchmarks higher also as appetite for risk permeates.
USD/CNH – CHINESE YUAN PRICE CHART: DAILY TIME FRAME (JULY 2019 TO JANUARY 2020)
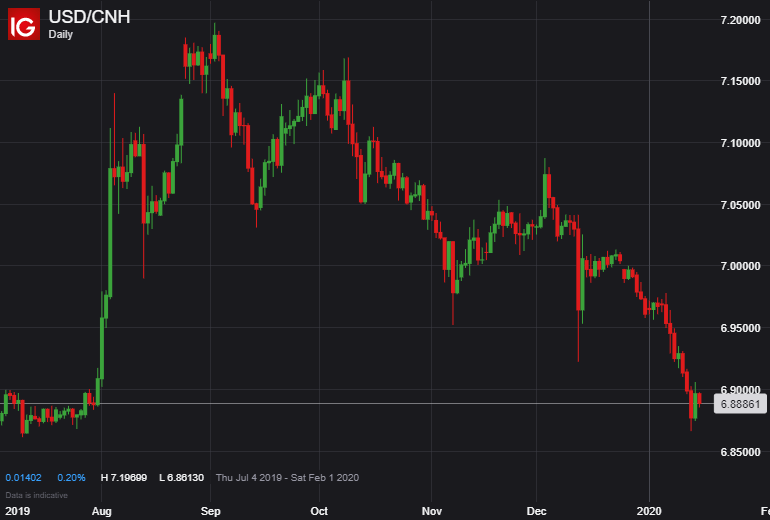
Another major asset reflecting the market's reaction to trade war developments between Washington and Beijing is the US Dollar to Chinese Yuan exchange rate. The offshore Yuan has surged roughly 4.5% against the US Dollar since spot USD/CNH topped out near the 7.2000 price level last September amid peak tariff threats from President Trump and PBoC intervention.
Owing to the recent improvement in US-China trade relations with the phase one trade agreement, the US Treasury has officially removed China from its list of currency manipulators. Spot USD/CNH seems to be finding technical support around the 6.8750 mark so far with further strength in the Chinese Yuan potentially limited due to roughly $350 billion of tariffs still imposed on Chinese goods.
DXY – US DOLLAR INDEX PRICE CHART: DAILY TIME FRAME (JULY 2019 TO JANUARY 2020)
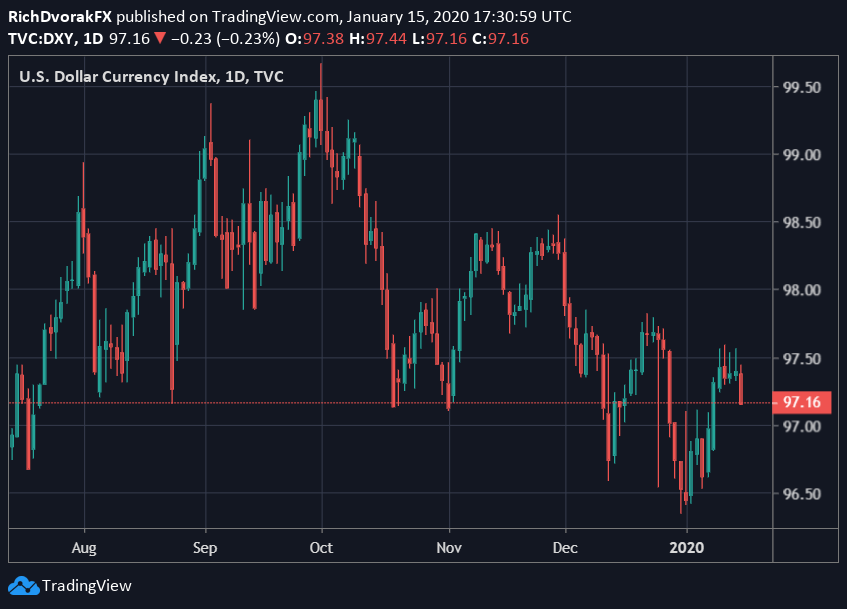
Chart created by @RichDvorakFX with TradingView
Weakness in USD price action is also reflected more broadly in the US Dollar Index (DXY). The popularly-refenced basket of major currency pairs details the US Dollar drifting 2.5% lower on balance since the recent high printed by the DXY Index last October, which could be explained primarily by fading demand for safe-haven currencies like the US Dollar.
-- Written by Rich Dvorak, Junior Analyst and Thomas Westwater, Internfor DailyFX.com
Connect with @RichDvorakFX and @FxWestwater on Twitter for real-time market insight


