


USD PRICE OUTLOOK: US DOLLAR SET FOR VOLATILITY WITH NFP REPORT & FOMC DECISION DUE
- The US Dollar has succumbed to an influx of risk appetite driven by hopes for a partial US-China trade deal, but another robust nonfarm payrolls (NFP) report could send the Greenback higher
- USD price action has swooned so far this month and pushed the DXY Index below its 200-DMA with the US Dollar edging lower over the last five consecutive trading sessions
- Read more on why traders should Expect US Jobs Data to Spark Volatility
Currency volatility continues to show signs of trickling its way back into the forex market. Expected USD price action remains bogged down, however, as measures of volatility begin to churn higher from record low levels.
Suppressed readings of US Dollar implied volatility, which have generally mirrored the flood of investor risk appetite in response to US-China trade deal optimism, can partly explain recent downside in USD prices and broader DXY Index.
This is largely due to the inherent relationship between volatility and perceived risk/uncertainty, but the recent drift lower in the US Dollar and currency volatility could be on the cusp of reversing its trend – likely a welcomed development for USD bulls.
US DOLLAR INDEX PRICE CHART: DAILY TIME FRAME (JUNE 18, 2019 TO DECEMBER 05, 2019)
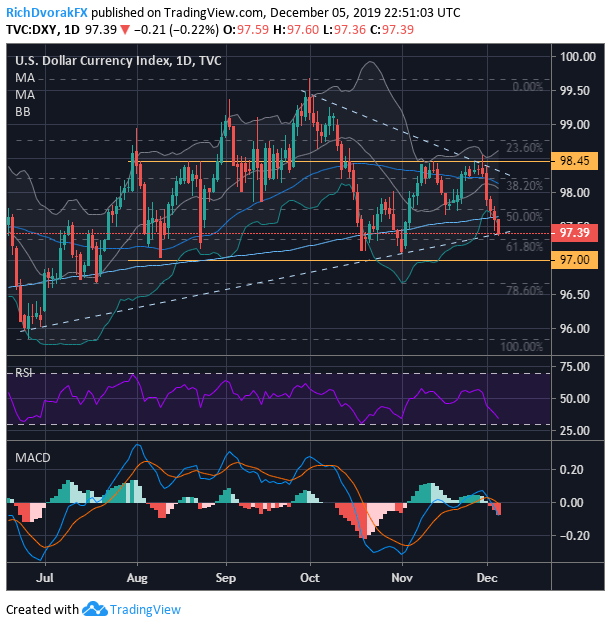
Chart created by @RichDvorakFX with TradingView
That said, there is an abundance of fundamental catalysts that lurk on the horizon with potential of sending volatility spiking. Two of the biggest immediate threats include Friday’s release of monthly US jobs data at 13:30 GMT and next Wednesday’s FOMC rate review slated to cross the wires at 19:00 GMT.
These are, of course, in addition to lingering risk that surrounds the US-China trade war as negotiators scramble to finalize the text for a supposed phase-one trade agreement before the December 15 tariff tranche deadline. The DXY Index nevertheless hovers around a critical technical support level, which, if breached, could trigger an aggressive acceleration in US Dollar selling pressure.
This confluent support zone is underpinned by the US Dollar’s 200-day simple moving average and 61.8% Fibonacci retracement of its June 25 intraday low to October 01 swing high. Meanwhile, the US Dollar Index is currently probing trendline support extended through the monthly lows printed in June and November. While there is still potential to bleed lower, the US Dollar might see a rebound soon considering as the RSI continues to edge deeper into “oversold territory” while the DXY Index rides its bottom Bollinger Band.
CHART OF MONTHLY CHANGE IN NONFARM PAYROLLS (NFP) – US JOBS REPORT

Another robust data print on the monthly change in nonfarm payrolls could reiterate the shift in monetary policy guidance by the Federal Reserve from dovish to neutral communicated at the central bank’s last interest rate decision.
The relatively less-dovish position was further detailed in the October Fed meeting minutes, but Fed Chair Powell and other FOMC officials have also noted that they could pivot back to an accommodative stance if the US economy fails to progress in-line with current outlook.
Correspondingly, the upcoming NFP report due for release this Friday could carry a great deal of weight seeing that the Fed – whose governing mandate includes the promotion of maximum employment – will provide an update to its quarterly economic forecasts (SEPs) next week.
CHART OF US DOLLAR IMPLIED VOLATILITY & TRADING RANGES (OVERNIGHT)
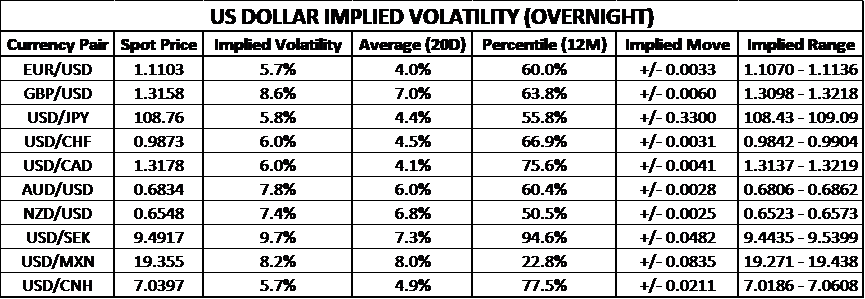
Alas, USD volatility could be set climb with US Dollar Outlook fixated predominantly on trade, jobs and the Fed. The market consensus estimate for the November NFP report is listed at +183K according to the DailyFX Economic Calendar. This compares to the prior month’s reading of +128K and year-to-date average monthly change of +167K and the 2018 average of +225K. Read more: How to Trade the Top 10 Most Volatile Currency Pairs.
-- Written by Rich Dvorak, Junior Analyst for DailyFX.com
Connect with @RichDvorakFX on Twitter for real-time market insight


