


Oil Price Talking Points
The price of oil trades to a fresh weekly low ($79.50) even as the Organization of Petroleum Exporting Countries (OPEC) and its allies remain reluctant to push product to pre-pandemic levels, and crude may face a further decline over the coming days as it struggles to fill the price gap from earlier this week.
Oil Fails to Fill Price Gap Even as OPEC+ Retains Production Schedule
Recent developments surrounding the price of oil warned of a near-term pullback as the Relative Strength Index (RSI) offered a textbook sell signal, and crude may face a larger correction over the coming days as US inventories increase for the second straight week.
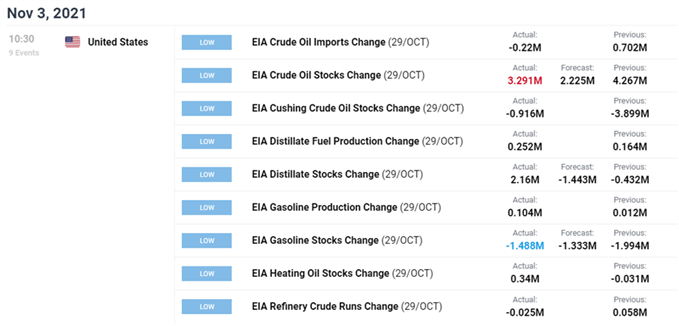
The latest figures from the Energy Information Administration (EIA) showed US stockpiles climbing 3.291M in the week ending October 29 versus forecasts for a 2.225M print, and it remains to be seen if OPEC and its allies will respond to the data prints coming out of the US as the most recent Monthly Oil Market Report (MOMR) insists that that “global demand next year is seen averaging 100.8 mb/d.”
As a result, the press release following the 22nd OPEC and non-OPEC Ministerial Meeting suggests the group is on a preset course as they plan to “adjust upward the monthly overall production by 0.4 mb/d for the month of December 2021,” and the efforts to “ensure a stable and a balanced oil market” may ultimately lead to higher oil prices as the recovery in US output remains subdued.
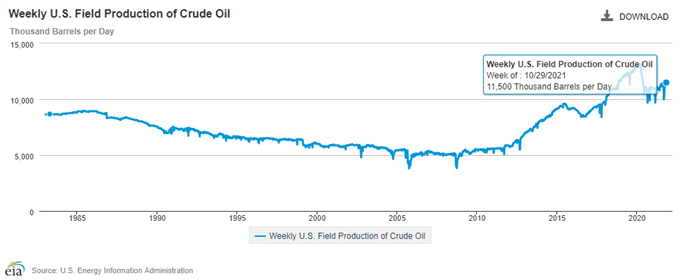
A deeper look at the EIA report showed weekly field output climbing to 11,500K after holding at 11,300K for two weeks to mark the highest reading since the disruptions caused by Hurricane Ida, and indications of limited supply may encourage OPEC and its allies to carry the current production schedule into 2022 as the group retains an upbeat outlook for future consumption.
With that said, the price of oil may face a larger pullback ahead of the next Ministerial Meeting on December 2 as it fails to fill the price gap from earlier this week, but the decline from the yearly high ($85.41) may turn out to be a correction in the broader trend as OPEC and its allies retain a gradual approach is restoring production to pre-pandemic levels.
Oil Price Daily Chart

Source: Trading View
- Keep in mind, the price of oil cleared the July high ($76.98) after defending the May low ($61.56), with the 50-Day SMA ($76.16) establishing a positive slope during the same period as crude broke out of the descending channel from earlier this year.
- As a result, the rally from the August low ($61.74) pushed the Relative Strength Index (RSI) above 70 for the first time since July, but crude appears to have reversed ahead of the October 2014 high ($92.96) as the oscillator falls back from overbought territory to indicate a textbook sell signal.
- Lack of momentum to hold above the $84.20 (78.6% expansion) region has pushed the price of oil back below $81.60 (100% expansion), with a break/close below the $78.50 (61.8% expansion) to $78.80 (50% retracement) area opening up former-resistance zone around $76.90 (50% retracement) to $77.30 (78.6% expansion).
- Next area of interest comes in around $74.00 (61.8% expansion) to $74.40 (50% expansion) followed by the Fibonacci overlap around $69.40 (38.2% expansion) to $71.70 (50% expansion).

--- Written by David Song, Currency Strategist
Follow me on Twitter at @DavidJSong


