


Oil Price Talking Points
The price of oil slips to a fresh weekly low ($82.53) amid a larger-than-expected rise in US inventories, and crude may face a larger pullback over the remainder of the month as the Relative Strength Index (RSI) falls back from overbought territory to indicate a textbook sell signal.
Oil Price Susceptible to Larger Pullback as RSI Sell Signal Emerges
The price of oil continues to pull back from the monthly high ($85.41) as fresh data prints coming out of the US dampen the outlook for consumption, with crude inventories expanding for the third time this month.
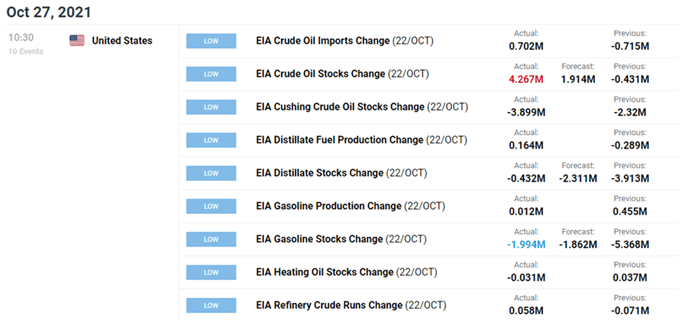
US stockpiles increased 4.267M in the week ending October 22 amid forecasts for a 1.914M rise, and it remains to be seen if the Organization of Petroleum Exporting Countries (OPEC) will respond to the rise in crude inventories as the most recent Monthly Oil Market Report (MOMR) reveals that “world oil demand is estimated to increase by 5.8 mb/d in 2021, revised down from 5.96 mb/d in the previous month’s assessment.”
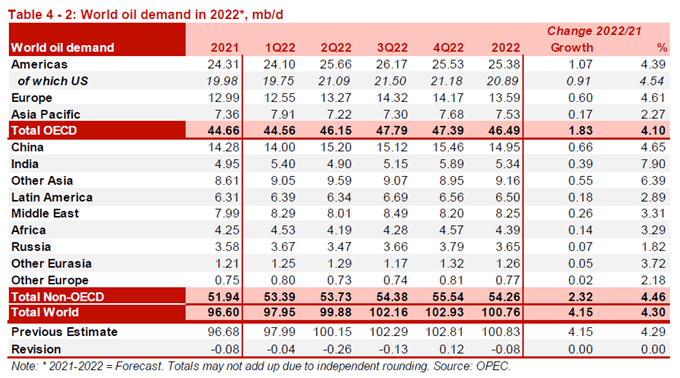
The MOMR emphasizes that “the downward revision is mainly driven by lower-than-expected actual data for the first three quarters of this year,” with the report going onto say that “the world is expected to consume 96.6 mb/d of petroleum products this year.”
Nevertheless, the MOMR points out that “world oil demand growth is unchanged at 4.2 mb/d” for 2022, and OPEC and its allies may remain reluctant to boost production as “global demand next year is seen averaging 100.8 mb/d.”
In turn, current market conditions may keep the price of oil afloat ahead of the next OPEC and non-OPEC Ministerial Meeting on November 4 as the group stays on track to boost “overall production by 0.4 mb/d for the month of October 2021,” and the recent weakness in crude prices may turn out to be a correction in the broader trend as the US still struggles to recover from the disruptions caused by Hurricane Ida.
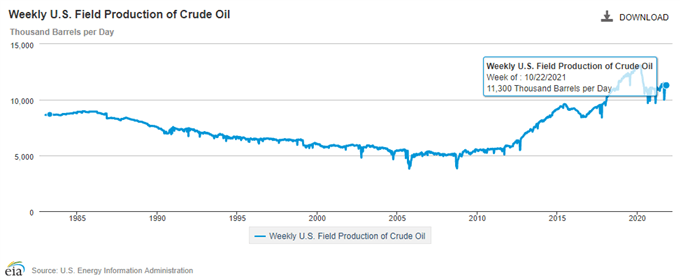
A deeper look at the update from the Energy Information Administration (EIA) showed weekly field output holding steady at 11,300K for the second week, which remainsbelow the 11,500K print seen in the week ending August 27, and expectations for stronger demand along with indications of limited supply may continue to act as a backstop for the price of oil as OPEC+ appears to be in no rush to restore production towards pre-pandemic levels.
With that said, the price of oil may continue to exhibit a bullish trend throughout the remainder of the year as it breaks out of the descending channel, but crude may face a larger correction over the remainder of the month as the Relative Strength Index (RSI) falls back from overbought territory to signal a textbook sell signal.
Oil Price Daily Chart
Source: Trading View
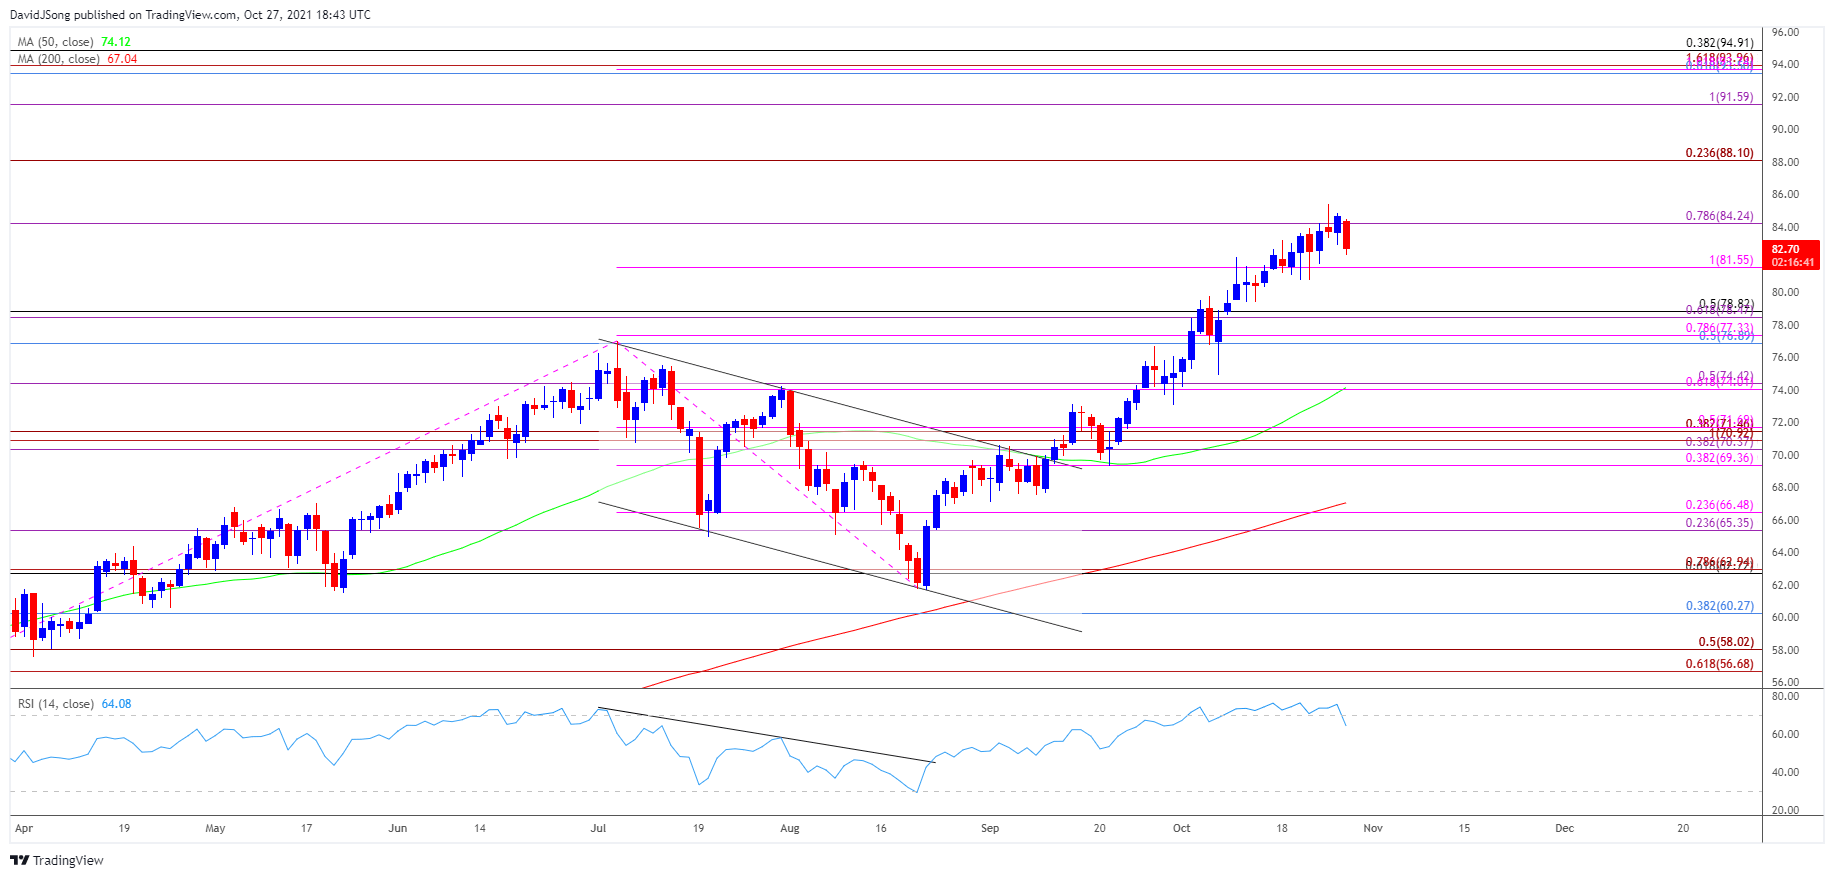
- Keep in mind, the price of oil has cleared the July high ($76.98) after defending the May low ($61.56), with the 50-Day SMA ($74.12) establishing a positive slope during the same period as crude broke out of the descending channel from earlier this year.
- As a result, the recent rally in the price of oil pushed the Relative Strength Index (RSI) above 70 for the first time since July, but crude appears to be stalling ahead of the October 2014 high ($92.96) as the oscillator falls back from overbought territory to indicate a textbook sell signal.
- In turn, lack of momentum to hold above the $84.20 (78.6% expansion) region may push the price of oil towards $81.60 (100% expansion), with the next area of interest coming in around $78.50 (61.8% expansion) to $78.80 (50% retracement).
- It remains to be seen if the former-resistance zone around $76.90 (50% retracement) to $77.30 (78.6% expansion) will offer support as the 200-Day SMA ($67.04) continues to track the positive slope carried over from earlier this year, but a move below the 50-Day SMA ($74.12) opens up the Fibonacci overlap around $69.40 (38.2% expansion) to $71.70 (50% expansion).

--- Written by David Song, Currency Strategist
Follow me on Twitter at @DavidJSong


