


Gold Price Talking Points
The price of gold attempts to retrace the decline from last week as the 10-Year US Treasury yield pulls back from a fresh monthly high (1.67%), and the precious metal may stage a larger recovery during the Federal Reserve’s blackout period as it extends the series of higher highs and lows from the start of the week.
Gold Price Eyes 200-Day SMA Again During Fed Blackout Period
The price of gold looks poised to test the 200-Day SMA ($1794) for the second time this month as it bounces back ahead of the October low ($1746), and a larger pullback in longer-dated Treasury yields may keep the precious metal afloat as it retraces the decline following the update to the US Consumer Price Index (CPI).
Looking ahead, it remains to be seen if the Federal Open Market Committee (FOMC) will respond to the mixed data prints coming out of the US economy as the central bank continues to brace for a transitory rise in inflation, and recent remarks from Richmond Fed President Thomas Barkin, who votes on the FOMC this year, suggests the central bank will stick to its exit strategy as the official insists that the committee will “have a discussion in November on tapering.”
In turn, speculation for an imminent shift in Fed policy may keep a lid on the price of gold as Chairman Jerome Powell and Co. look to scale back purchases of Treasury securities and mortgage-backed securities (MBS) over the coming months, and another move above the 200-Day SMA ($1794) may end up being short lived like the behavior seen earlier this month.
With that said, the price of gold may push towards the October high ($1801) during the Federal Reserve’s blackout period as it extends the series of higher highs and lows from the start of the week, but the recovery from the August low ($1682) may turn out to be a correction in the broader trend rather than a change in market behavior as longer-dated US yields continue to retrace the decline from earlier this year.
Gold Price Daily Chart
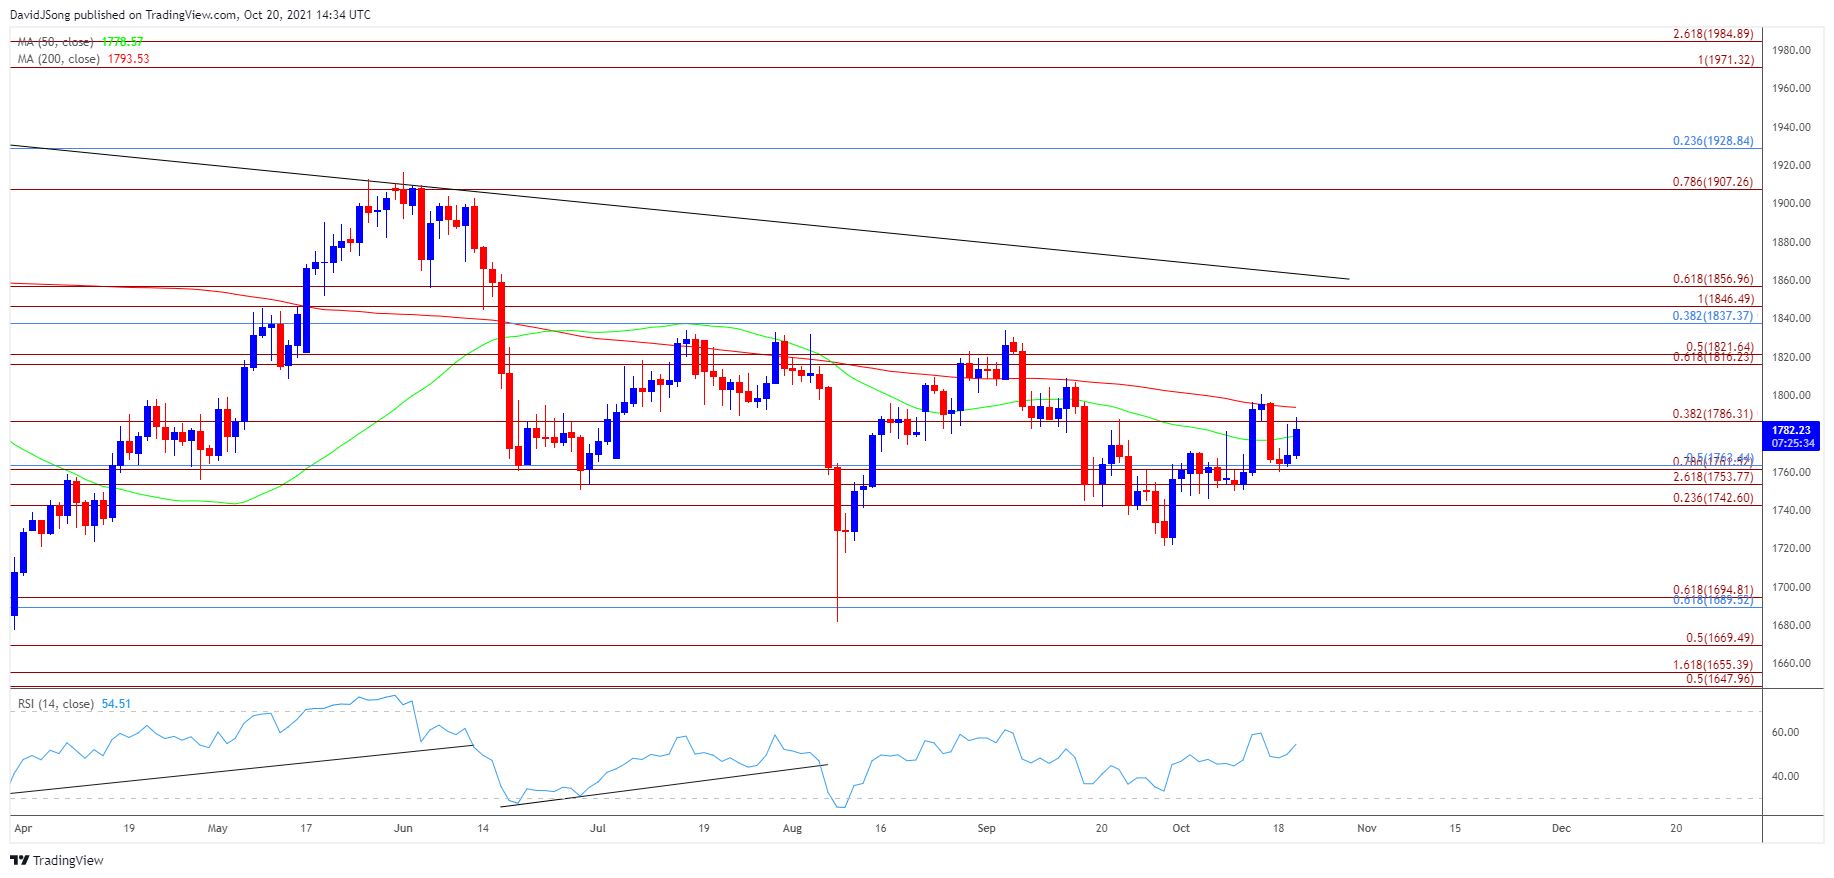
Source: Trading View
- Keep in mind, the negative slope in the 200-Day SMA ($1794) indicates that the broader trend for bullion remains tilted to the downside, with a ‘death cross’ formation taking shape in August as the Relative Strength Index (RSI) pushed into oversold territory.
- However, lack of momentum to test the March low ($1677) generated a textbook buy signal in the RSI as the oscillator climbed back above 30, with rebound from the August low ($1682) pushing the price of gold briefly above the 200-Day SMA ($1794) going into September.
- A similar dynamic appears to be taking shape this month as the recent move above the moving average was short-lived, and failure to close above the $1786 (38.2% expansion) region may push the price of gold back towards the monthly low ($1746), with a break/close below the Fibonacci overlap around $1743 (23.6% expansion) to $1763 (50% retracement) bringing the September low ($1722) on the radar.
- Nevertheless, a close above the $1786 (38.2% expansion) region may push the price of gold back above the 200-Day SMA ($1794) for another run at the $1816 (61.8% expansion) to $1822 (50% expansion) area.

--- Written by David Song, Currency Strategist
Follow me on Twitter at @DavidJSong


