


Japanese Yen Talking Points
USD/JPY struggles to extend the four day rally amid the kneejerk reaction to the unexpected uptick in the US Consumer Price Index (CPI), and looming developments in the Relative Strength Index (RSI) may indicate a near-term pullback in the exchange rate if it falls back from overbought territory to establish a textbook sell signal.
USD/JPY Rate Rally Vulnerable to RSI Sell Signal
USD/JPY pulls back from a fresh monthly high (113.81) to largely track the recent weakness in longer-dated US Treasury yields, with the exchange rate showing a limited reaction to the Federal Open Market Committee (FOMC) Minutes even as “participants foresaw rapid growth this year, and several highlighted that the economy had shown resilience in the face of the recent wave of infections.”
The transcript from the September meeting suggests the FOMC is on track to scale back monetary support as “participants generally saw the risks to the outlook for economic activity as broadly balanced,” and its seems as though the central bank is on track to switch gears later this year as “participants noted that if a decision to begin tapering purchases occurred at the next meeting, the process of tapering could commence with the monthly purchase calendars beginning in either mid-November or mid-December.”
As a result, speculation for an imminent shift in Fed policy may keep USD/JPY afloat as the Bank of Japan (BoJ) continues to carry out its Quantitative and Qualitative Easing (QQE) Program with Yield Curve Control (YCC), but a further advance in the exchange rate may fuel the tilt in retail sentiment like the behavior seen earlier this year.
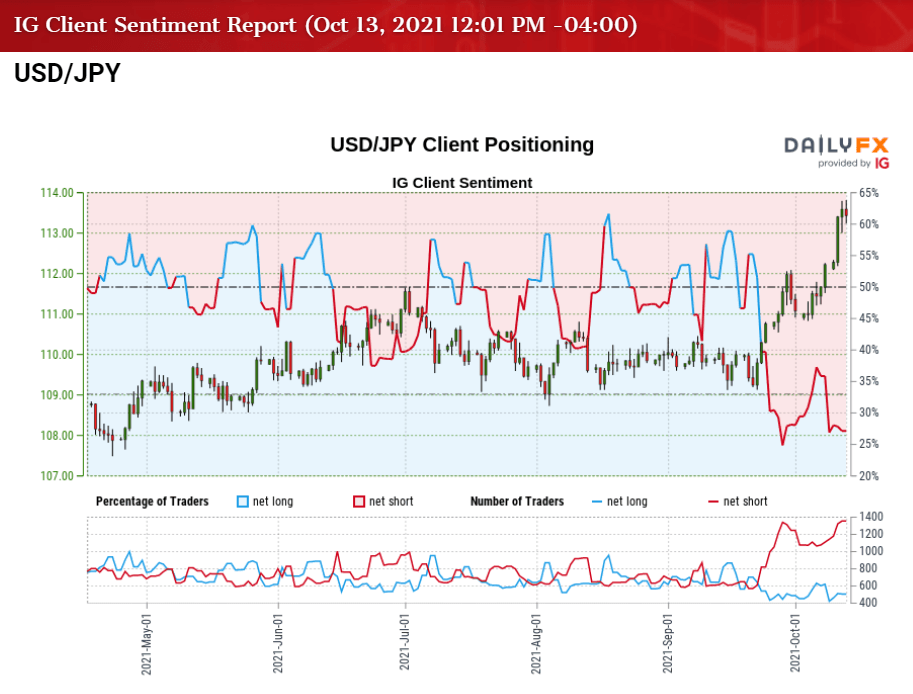
The IG Client Sentiment report shows only 26.34% of traders are currently net-long USD/JPY, with the ratio of traders short to long standing at 2.80 to 1.
The number of traders net-long is 0.41% lower than yesterday and 17.98% lower from last week, while the number of traders net-short is 5.65% higher than yesterday and 25.23% higher from last week. The decline in net-long interest could be a function of profit taking behavior as USD/JPY pulls back from a fresh monthly high (113.81), while the rise in net-short position has fueled the tilt in retail sentiment as 30.67% of traders were net-long the pair at the start of the week.
With that said, USD/JPY may continue to exhibit the bullish trend from earlier this year amid the diverging paths between the FOMC and BoJ, but looming developments in the Relative Strength Index (RSI) may indicate a near-term pullback in the exchange rate if it falls back from overbought territory to offer a textbook sell signal.

USD/JPY Rate Daily Chart

Source: Trading View
- The broader outlook for USD/JPY remains constructive as it trades to fresh yearly highs in the second half of 2021, with the 200-Day SMA (108.55) indicating a similar dynamic as it retains the positive slope from earlier this year.
- The Relative Strength Index (RSI) showed a similar dynamic as the oscillator pushed into overbought territory for the first time since the first quarter of 2021, but the indicator may offer a textbook sell signal over the coming days if it pushes below 70.
- In turn, USD/JPY appears to be reversing ahead of the November 2018 high (114.23) amid the lack of momentum to push above the Fibonacci overlap around 113.80 (23.6% expansion) to 114.30 (23.6% retracement), and failure to retain the recent series of higher highs and lows may push the exchange rate back towards the 112.40 (61.8% retracement) to 112.80 (38.2% expansion) region as the bullish momentum abates.
- Next area of interest comes in around 111.10 (61.8% expansion) to 111.60 (38.2% retracement), with a move below the 50-Day SMA (110.41) opening up the 109.40 (50% retracement) to 110.00 (38.2% expansion) region.

--- Written by David Song, Currency Strategist
Follow me on Twitter at @DavidJSong


