


Gold Price Talking Points
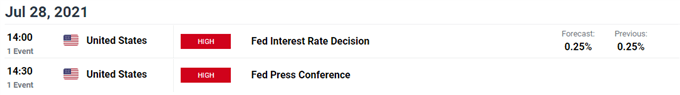
The price of gold consolidates ahead of the Federal Reserve interest rate decision on July 28 as the central bank is expected to retain the current policy, but a change in the forward guidance for monetary policy may produce headwinds for bullion if the central bank shows a greater willingness to scale back its emergency measures.
Gold Price Outlook Dependent on Federal Reserve Forward Guidance
The price of gold struggles to retain the advance from the monthly low ($1766) after failing to climb back above the 50-Day SMA ($1833), but more of the same from the Federal Open Market Committee (FOMC) may prop up the precious metal as the recent rebound in longer-term US Treasury yields appear to be unraveling.
The semi-annual testimony from Chairman Jerome Powell suggests the FOMC is in no rush to switch gears as the central bank head tells US lawmakers that “reaching the standard of ‘substantial further progress’ is still a ways off,” and the central bank may attempt to buy time ahead of the quarterly meeting in September as Powell pledges to “provide notice well in advance of an announcement to reduce the pace of purchases.”
As a result, the Fed rate decision may keep US yields under pressure as if the central bank stays on track to “increase its holdings of Treasury securities by at least $80 billion per month and of agency mortgage‑backedsecurities by at least $40 billion per month,” but indications of a looming exit strategy may drag on bullion as Fed officials forecast two rate hikes for 2023.
With that said, the price of gold may move to the beat of its own drum ahead of the Fed rate decision as the double-bottom formation from earlier this year seems to have run its course, and lack of momentum to push back above the 50-Day SMA ($1833) may keep the precious metal within a defined range as the recent rebound in longer-term US yields appear to be unraveling.
Gold Price Daily Chart

Source: Trading View
- Keep in mind, a double-bottom emerged in March as the price of gold failed to test the June 2020 low ($1671), with the key reversal pattern pushing the precious metal back above the 200-Day SMA ($1822) for the first time since February.
- At the same time, the Relative Strength Index (RSI) pushed into overbought territory for the first time since July 2020 as the price of gold appeared to be on track to test the January high ($1959), but the double-bottom formation seems to have run its course as the RSI no longer tracks the upward trend from earlier this year.
- In turn, the price of gold appears to have reversed ahead of the $1837 (38.2% retracement) to $1847 (100% expansion) region amid the lack of momentum to push back above the 50-Day SMA ($1833), but need a break/close below the $1786 (38.2% expansion) area to bring the Fibonacci overlap around $1743 (23.6% expansion) to $1763 (50% retracement)on the radar.

--- Written by David Song, Currency Strategist
Follow me on Twitter at @DavidJSong


