


Gold Price Talking Points
The price of gold appears to be making another attempt to test the 50-Day SMA ($1872) ahead of the Federal Reserve’s last meeting for 2020, but the rebound from the monthly low ($1776) may continue to unravel as long as the Relative Strength Index (RSI) tracks the downward trend from earlier this year.
Gold Price Remains Capped by 50-Day SMA Ahead of Fed Rate Decision
The price of gold may continue to move to the beat of its own drum as the low interest rate environment along with the ballooning central bank balance sheets no longer provides a backstop for bullion, and the decline from the record high ($2075) appears to be a shift in market behavior rather than an exhaustion in the bullish trend as the precious metal no longer trades to fresh yearly highs during every single month in 2020.
In turn, the V-shape recovery following the failed attempt to test the July low ($1758) may continue to be capped by the 50-Day SMA ($1872) even though the Fed’s balance sheet approaches the record high, and it remains to be seen if the Federal Open Market Committee (FOMC) will deliver additional monetary stimulus ahead of 2021 amid signs of a slowing recovery.
Nevertheless, the US Dollar may continue to reflect an inverse relationship with investor confidence as Chairman Jerome Powell and Co. rely on their unconventional tools to support the US economy, and the tilt in retail sentiment also looks poised to persist as the net-long US Dollar bias from earlier this year resurfaces.
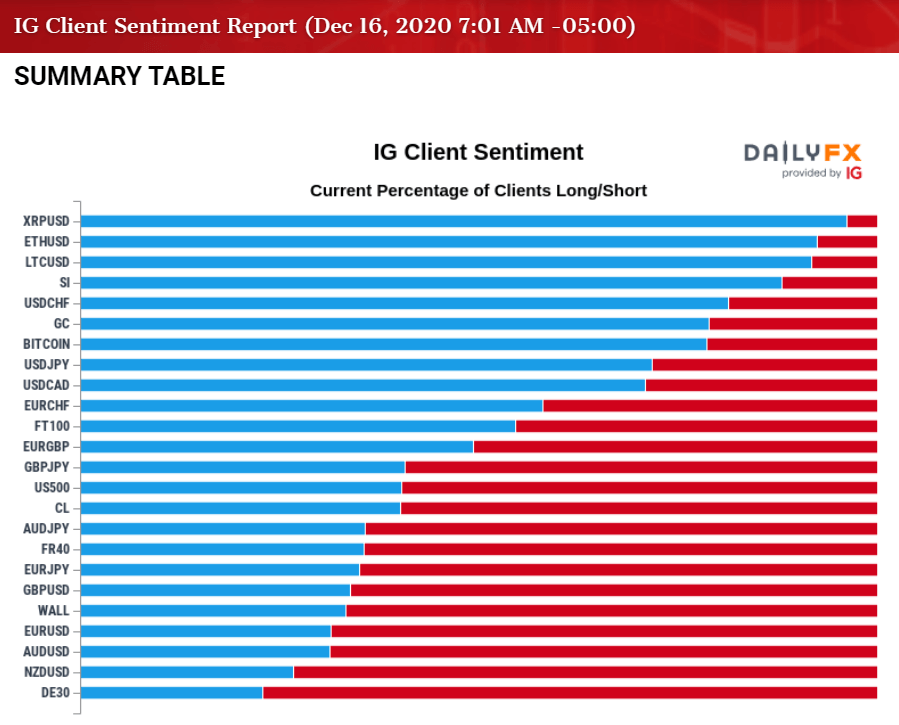
The IG Client Sentiment report shows traders are net-long USD/CHF, USD/JPY and USD/CAD, while the crowd remains GBP/USD, EUR/USD, AUD/USD and NZD/USD even though the US Dollar price collapse enters its fifth consecutive week.
Looking ahead, swings in risk appetite may continue to influence the US Dollar as key market trends remain in place, but the price of gold may continue to move to the beat of its own drum as the advance from themonthly low ($1776) appears to be capped by the 50-Day SMA ($1872).
With that said, the Relative Strength Index (RSI) may highlight similar dynamic as it appears to be responding to trendline resistance, and the oscillator may continue to track the bearish formation from earlier this year as the record high ($2075) appears to be a shift in market behavior rather than an exhaustion in the bullish trend.

Gold Price Daily Chart

Source: Trading View
- The price of gold pushed to fresh yearly highs throughout the first half 2020, with the bullish price action also taking shape in August as the precious metal tagged a new record high ($2075).
- However, the bullish behavior failed to materialize in September as the price of gold traded below the 50-Day SMA ($1872) for the first time since June, with developments in the Relative Strength Index (RSI) negating the wedge/triangle formation established in August as the oscillator slipped to its lowest level since March.
- The correction from the record high ($2075) now indicates a potential shift in market behavior rather than an exhaustion in the bullish trend as the price of gold trades at its lowest level since July, with the RSI highlighting a similar dynamic as it dips into oversold territory for the first time since 2018.
- However, price of gold staged a V-shape recovery ahead of the July low ($1758) amid the failed attempt to test the $1754 (261.8% expansion) to $1762 (78.6% expansion) region, with the RSI reflecting a textbook buy signal as the indicator quickly crosses back above 30 and recovered from oversold territory.
- The opening range for December raised the scope for higher gold prices as the precious metal extended the series of higher highs and lows from the start of the month, with the break/close above the former support zone around $1847 (100% expansion) to $1857 (61.8% expansion) bringing the Fibonacci overlap around $1907 (78.6% expansion) to $1920 (161.8% expansion) back on the radar.
- The rebound from the November low ($1765) appears to be making another attempt to test the 50-Day SMA ($1872), but lack of momentum to hold above the Fibonacci overlap around $1847 (100% expansion) to $1857 (61.8% expansion) has pushed the price of gold back towards the $1816 (61.8% expansion) to $1822 (50% expansion) area, with the next downside region of interest coming in around $1786 (38.2% expansion).

--- Written by David Song, Currency Strategist
Follow me on Twitter at @DavidJSong


