


Gold Price Talking Points
The price of gold trades in a narrow range following the limited reaction to the US Non-Farm Payrolls (NFP) report, and the precious metal may struggle to retain the series of higher highs and lows from the previous week as the Relative Strength Index (RSI) continues to track the downward trend carried over from August.
Gold Price Outlook Mired by Downward Trend in RSI
Gold may continue to reflect an inverse relation with the US Dollar ahead of the Federal Open Market Committee (FOMC) Minutes as the precious metal clings to the rebound from the September low ($1849) while the Greenback remains under pressure.

However, gold has failed to exhibit the bullish trend from earlier this year as it no longer trades to fresh yearly highs during every single month in 2020, and the lack of momentum to hold above the August low ($1863) may indicate a potential shift market behavior as bullion trades below the 50-Day SMA ($1944) for the first time since June.
In turn, the price of gold may struggle to extend the series of higher highs and lows from the previous week as the Federal Reserve relies on its current tools to support the US economy, and the FOMC Minutes may reveal more of the same for the next interest rate decision on November 5 as the Summary of Economic Projections (SEP) show the longer run interest rate forecast unchanged from the June meeting.
The wait-and-see approach for monetary policy may sap investor confidence as the Fed’s balance sheet narrows to $7.056 trillion from $7.093 trillion on September 21, and waning speculation for additional monetary stimulus may prop up the US Dollar as most Fed officials judged that “yield caps and targets would likely provide only modest benefits in the current environment.”
Nevertheless, Chairman Jerome Powell and Co. may keep the door open to further support the US economy as “several participants suggested that additional accommodation could be required,” and the dovish forward guidance paired with the low interest rate environment may continue to heighten the appeal of gold as an alternative to fiat-currencies as the central bank remains “committed to using our tools to do what we can, for as long as it takes, to ensure that the recovery will be as strong as possible.”
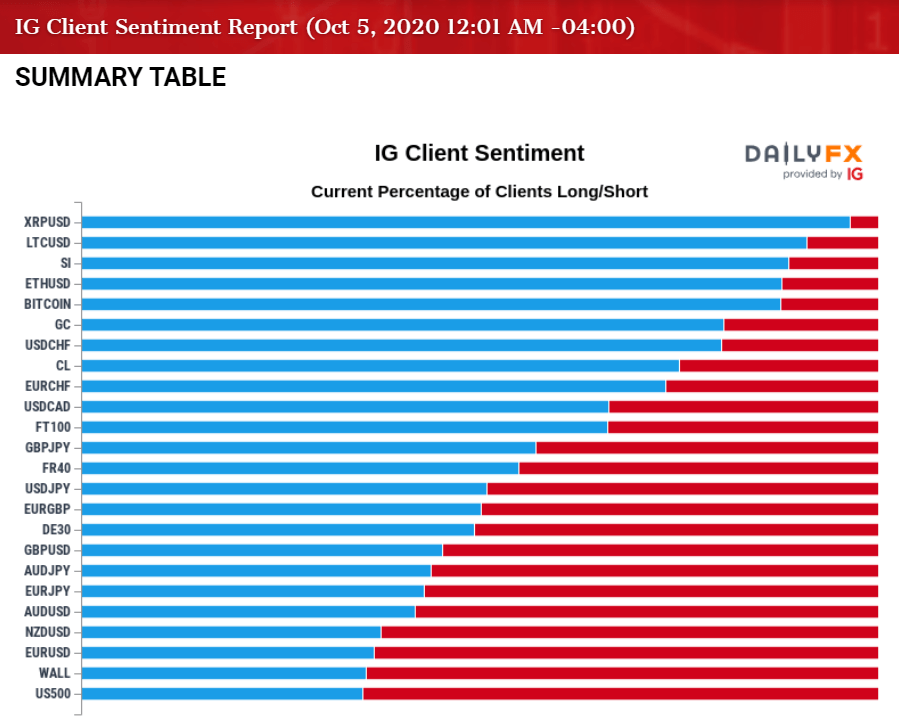
At the same time, the net-long US Dollar bias has resurfaced in October as the IG Client Sentiment report shows retail traders net-long USD/CHF, USD/CAD and USD/JPY, while the crowd is net-short GBP/USD, AUD/USD, NZD/USD and EUR/USD.
The tilt in retail sentiment may persist even though the FOMC plans to “achieve inflation that averages 2 percent over time,” and the crowding behavior in the US Dollar may coincide with the rebound in the gold prices as key market themes remain in place.
With that said, it remains to be seen if the correction from the record high ($2075) will turn out to be a material change in market behavior or an exhaustion of the bullish trend, and the Relative Strength Index (RSI) may offer a potential signal as the oscillator appears to be on track to threaten the downward trend established in August.

Sign up and join DailyFX Currency Strategist David Song LIVE for an opportunity to discuss potential trade setups.
Gold Price Daily Chart
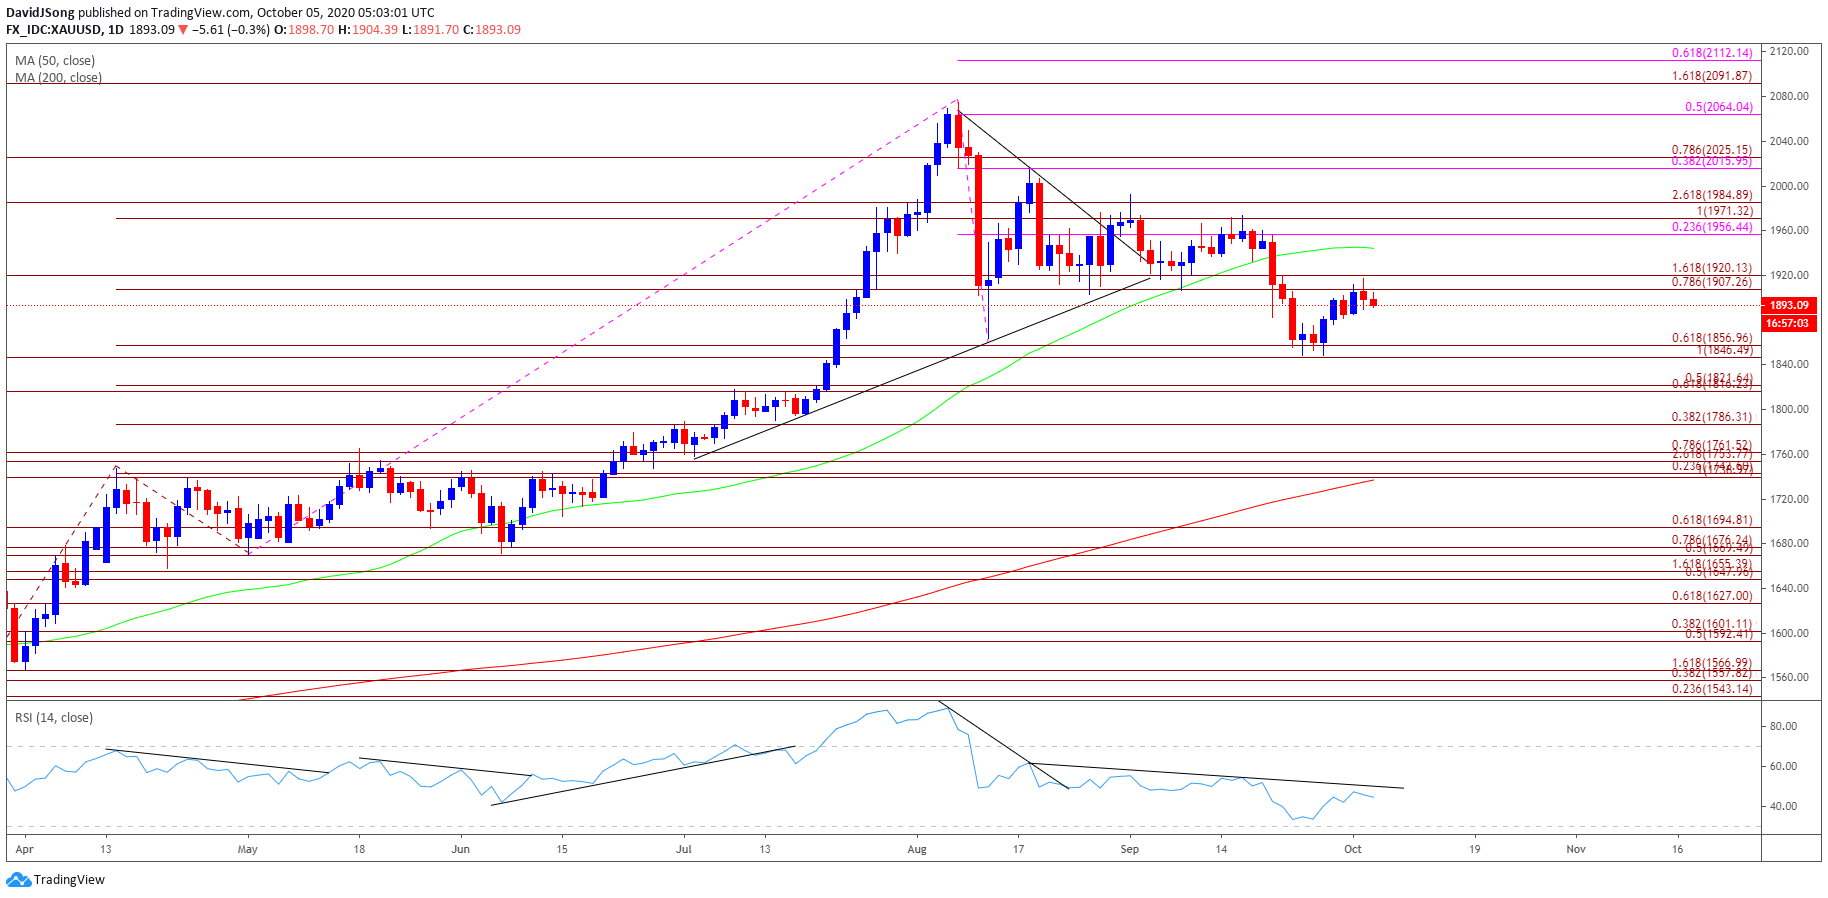
Source: Trading View
- The price of gold pushed to fresh yearly highs throughout the first half 2020, with the bullish price action also taking shape in August as the precious metal tagged a new record high ($2075).
- However, the bullish behavior failed to materialize in September as the price of gold traded below the 50-Day SMA ($1944) for the first time since June, with developments in the Relative Strength Index (RSI) negating the wedge/triangle formation established in August as the oscillator slipped to its lowest level since March.
- The decline from theyearly high ($2075) may turn out to be a change in trend as the RSI continues to track the downward trend carried over from August, but the indicator may show the bearish momentum abating if it clears trendline resistance following the failed attempt to push into oversold territory.
- Need a break/close above the $1907 (100% expansion) to $1920 (161.8% expansion) region to bring the $1956 (23.6% expansion) area on the radar, with the next region of interest coming in around $1971 (100% expansion) to $1985 (261.8% expansion).
- However, the price of gold may struggle to retain the advance from the September low ($1849) if it snaps the bullish price sequence from the previous week, with lack of momentum to break/close above the $1907 (100% expansion) to $1920 (161.8% expansion) region

--- Written by David Song, Currency Strategist
Follow me on Twitter at @DavidJSong


