


Gold Price Talking Points
The price of gold appears to be broadly tracking the change in global equity prices as bullion tags a fresh monthly low ($1883) earlier this week, and a further shift in risk sentiment may spur a test of the August low ($1863) as Relative Strength Index (RSI) sits at its lowest level since March.
Gold Price Trades Below 50-Day SMA for First Time Since June
The price of gold trades below the 50-Day SMA ($1941) for the first time since June even though Federal Reserve Chairman Jerome Powell strikes a dovish tone in front of US lawmakers, and it remains to be seen if the pullback from the record high ($2075) will turn out to be a change in market behavior or an exhaustion in the bullish trend as the Fed remains “committed to using our tools to do what we can, for as long as it takes, to ensure that the recovery will be as strong as possible.”
The price action following the Federal Open Market Committee (FOMC) interest rate decisions suggests market participants wereanticipating a more dovish forward guidance as the central bankplans to “achieve inflation that averages 2 percent over time,” and it seems as though the FOMC will rely on its current tools to support the US economy as Summary of Economic Projections (SEP) shows the longer run interest rate forecast unchanged from the June meeting.
Recent remarks from Chairman Powell also indicate that the FOMC is in no rush to alter the path for monetary policy amid the “adjustments to Main Street to provide greater support to small and medium-sized businesses and to nonprofit organizations,” and the Fed may continue to tweak its lending facilities rather than deploy more unconventional tools as the central bank vows to “increase its holdings of Treasury securities and agency mortgage-backed securities at least at the current pace.”
In turn, waning speculation for additional monetary support may continue to sap risk appetite as Fed officials insist that the “recovery has progressed more quickly than generally expected,” but the crowding behavior in the US Dollar largely persists even though retail traders turn net-long GBP/USD.
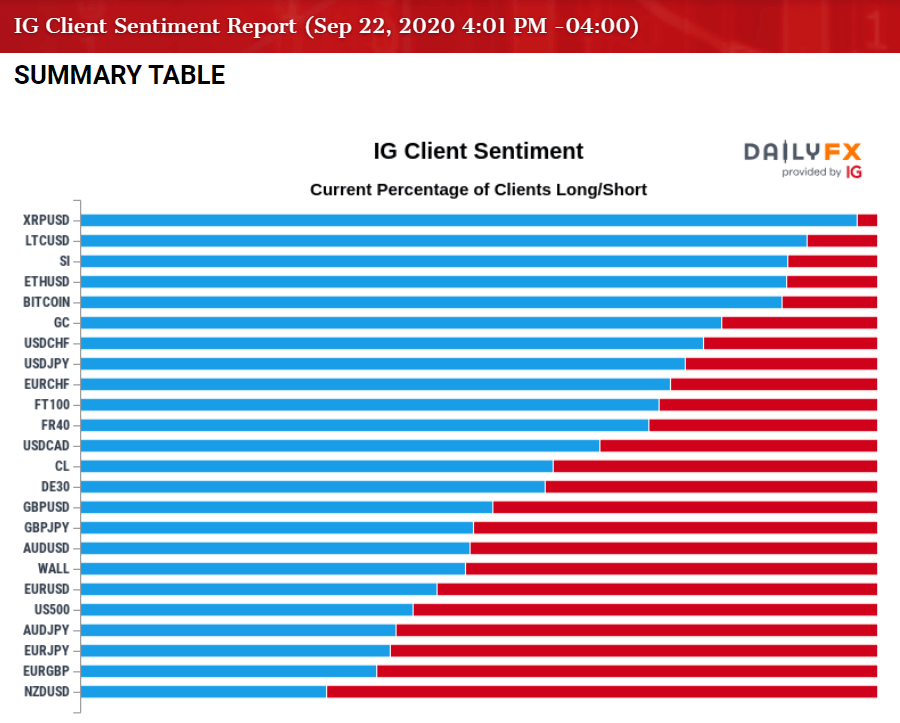
The IG Client Sentiment report continues to show retail tradersnet-long USD/CHF, USD/CAD and USD/JPY, with the crowd still net-short AUD/USD, EUR/USD and NZD/USD. Positioning in GBP/USD has flipped for the second time this month as 50.72% of traders are now net-long the pair, but broader market trends may persist over the remainder of the month as the Fed’s balance sheet holds above $7 trillion in September.
With that said, the Fed’s dovish forward guidance may continue to heighten the appeal of gold as an alternative to fiat-currencies, and the bullish trend in bullion may continue to coincide with the crowding behavior in the US Dollar as the macroeconomic outlook remains largely unchanged following the FOMC meeting.
However, the technical outlook is clouded with mixed signals as the price of gold trades below the 50-Day SMA ($1941) for the first time since June even though the moving average continues to track the positive slope from earlier this year, and the Relative Strength Index (RSI) may continue to show the bullish momentum abating as it sits at its lowest level since March.

Sign up and join DailyFX Currency Strategist David Song LIVE for an opportunity to discuss potential trade setups.
Gold Price Daily Chart
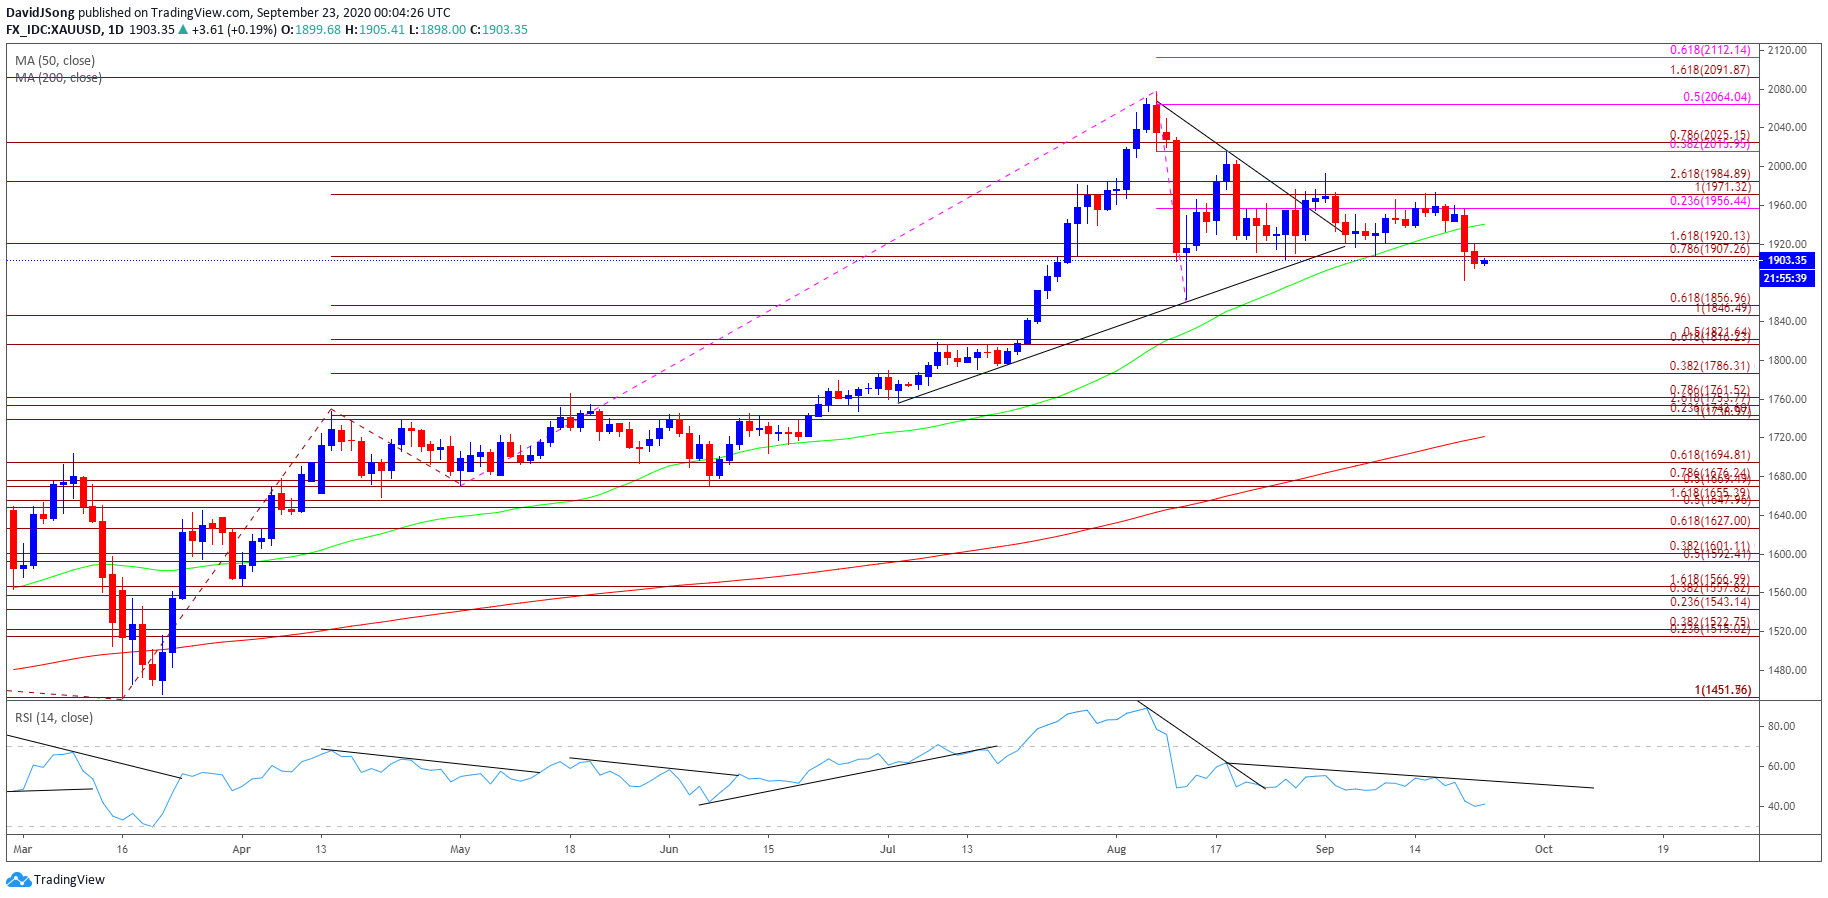
Source: Trading View
- The price of gold pushed to fresh yearly highs during every single month so far in 2020, with the bullish price action also taking shape in August as precious metal tagged a new 2020 high ($2075).
- The price of gold cleared the previous record high recorded in September 2011 ($1921) even though the Relative Strength Index (RSI) failed to retain the upward from June, but the indicator registered a new extreme reading (88) for 2020 as the oscillator pushed into overbought territory for the third time this year.
- However, the bullish behavior has failed to materialize in September as the price of gold trades below the 50-Day SMA ($1941) for the first time since June, with recent developments in the RSI negating the wedge/triangle formation established in August as the indicator sits at its lowest level since March.
- Lack of momentum to hold above the $1907 (100% expansion) to $1920 (161.8% expansion) region brings the August low ($1863) on the radar as it largely lines up with the Fibonacci overlap around $1847 (100% expansion) to $1857 (61.8% expansion), with the next area of interest coming in around $1816 (61.8% expansion) to $1822 (50% expansion).
- At the same time, failure to break the August low ($1863) may generate range bound conditions, but need a break/close above the overlap around $1971 (100% expansion) to $1985 (261.8% expansion) to bring the topside back on the radar.

--- Written by David Song, Currency Strategist
Follow me on Twitter at @DavidJSong


