


Gold Price Talking Points
The price of gold approaches the yearly high ($1765) as the Federal Reserve’s balance sheet contracts for the first time since the outbreak of COVID-19, and current market conditions may keep the precious metal afloat as the reversal from the May low ($1670) appears to be gathering pace.
Gold Price Approaches 2020 High as Fed Balance Sheet Contracts
Goldtrades to a fresh monthly high ($1759) as the update to the Fed’s balance sheet shows total assets narrowing to $7.09 trillion from $7.17 trillion on June 8, and the price for bullion may extend the bullish behavior from earlier this year as it carves a fresh series of higher highs and lows.
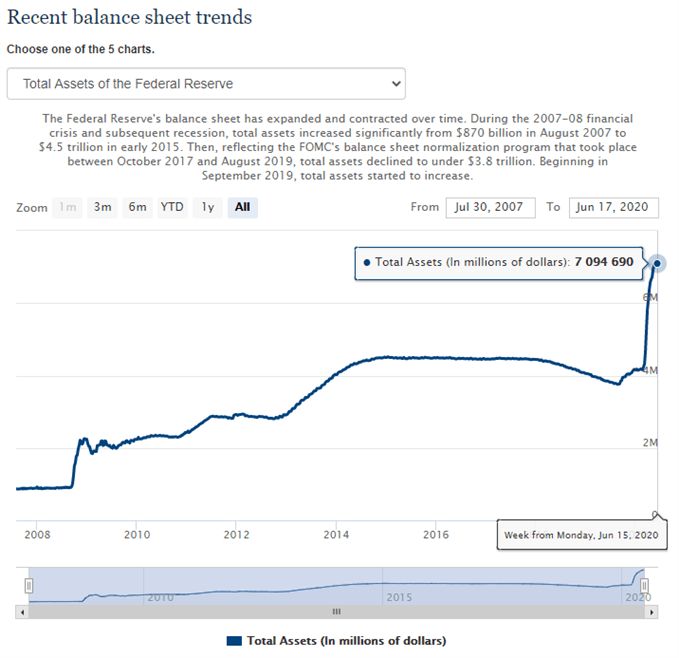
Source: FOMC
Gold has traded to fresh yearly highs during every single month so far in 2020, and the trend may persist despite the limited reaction to the Federal Reserve testimony as Chairman Jerome Powell vows to “increase our holdings of Treasury securities and agency mortgage-backed securities over coming months at least at the current pace.”
In turn, the contraction in the Fed’s balance sheet is likely to be short lived as the Federal Open Market Committee (FOMC) announces that the Secondary Market Corporate Credit Facility (SMCCF) “will purchase corporate bonds to create a corporate bond portfolio that is based on a broad, diversified market index of U.S. corporate bonds,” but it seems as though there’s little interest to implement more non-standard measures as the update to the Summary of Economic Projections (SEP) show “a general expectation of an economic recovery beginning in the second half of this year.”
Recent remarks from Fed officials suggest the central bank will carry out a wait-and-see over the coming months as Chairman Powell and Co. pledge to “evaluate our monetary policy stance and communications as more information about the trajectory of the economy becomes available,” and the FOMC may scale back the dovish forward guidance at the next interest rate decision on July 29 as Vice Chair Richard Clarida emphasizes that the committee “will wind down these lending facilities at such time as we determine the circumstances we confront are no longer unusual or exigent,”
With that said, the FOMC appears to be moving to the sidelines afterexpanding the scope of the Main Street Lending Program “to allow more small and medium-sized businesses to be able to receive support,” but the low interest rate environment along with the ballooning central bank balance sheets may continue to act as a backstop for the price of goldas marketparticipants look for an alternative to fiat-currencies.

Sign up and join DailyFX Currency Strategist David Song LIVE for an opportunity to discuss potential trade setups.
Gold Price Daily Chart

Source: Trading View
- The opening range for 2020 instilled a constructive outlook for the price of gold as the precious metal cleared the 2019 high ($1557), with the Relative Strength Index (RSI) pushing into overbought territory during the same period.
- A similar scenario materialized in February, with the price of gold marking the monthly low ($1548) during the first full week, while the RSI broke out of the bearish formation from earlier this year to push back into overbought territory.
- However, the monthly opening range for March as less relevant amid the pickup in volatility, with the decline from the monthly high ($1704) leading to a break of the January low ($1517).
- Nevertheless, the reaction to the former-resistance zone around $1450 (38.2% retracement) to $1452 (100% expansion) instilled a constructive outlook for bullion especially as the RSI reversed course ahead of oversold territory and broke out of the bearish formation from February.
- In turn, gold cleared the March high ($1704) to tag a new yearly high ($1748) in April, with the bullish behavior also taking shape in May as the precious metal traded to a fresh 2020 high ($1765).
- The bullish behavior may persist in June as the reversal from the May low ($1670) produces a break of the monthly opening range, with the RSI highlighting a similar dynamic as the indicator clearsthe negative slope from the previous month.
- Need a close above $1754 (261.8% expansion) to open up the $1786 (38.2% expansion) region, with the 2012 high ($1796) next on the radar.

--- Written by David Song, Currency Strategist
Follow me on Twitter at @DavidJSong


