S&P 500, FTSE 100 Analysis and News


S&P 500 | Equities Slump on Hot CPI
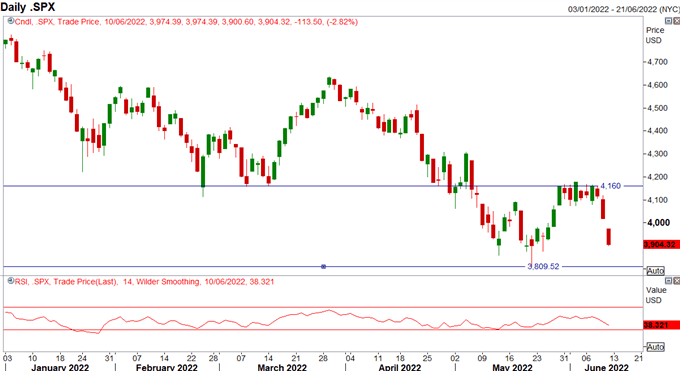
Rally sellers remain in control of the equity space and following the hot CPI print at 8.6%, the peak inflation narrative has been kicked down the road. As such, downside momentum in equities has accelerated as markets reprice a more hawkish Federal Reserve with a possible 75bps hike in the Summer being mooted. Elsewhere, the latest U. of Michigan Sentiment data crashing to a record low adds to the bearish sentiment and thus keeps the YTD low at ~3800 in focus. As highlighted previously, with inflation remaining sticky and US yields targeting 3.20%, the bias remains to fade rallies.
S&P 500 Chart: Daily Time Frame

Source: Refinitiv
| Change in | Longs | Shorts | OI |
| Daily | 1% | -1% | 0% |
| Weekly | 15% | -13% | -1% |
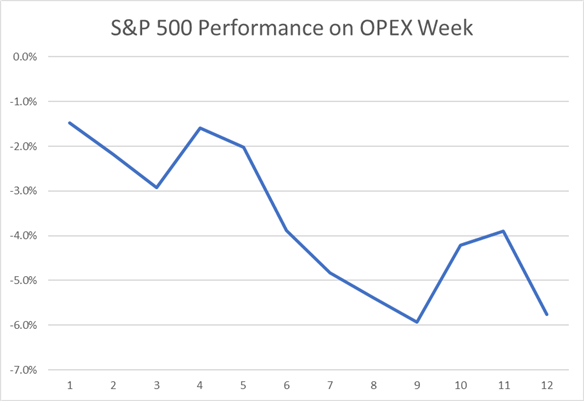
Looking ahead to next week, the key focus will be the Fed rate decision on Wednesday, but it is worth bearing in mind that quarterly option expiries will also be taking place on Friday, also known as quadruple witching. OpEx is an event where stock options expire on the third week of the month, which throughout 2021 had typically coincided with equities coming under pressure. As shown in the image below, the cumulative performance of the S&P 500 in the third week of each month in 2021 was -5.8% (Figure 1)
Figure 1

Source: Refinitiv, DailyFX
FTSE 100 | Bank of England To Remain a Cautious Hiker
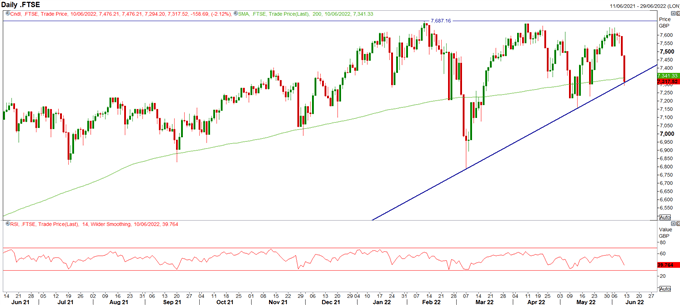
While the hot US inflation print has exacerbated the sell-off for the FTSE, renewed lockdown concerns in China have also weighed on the index with China-exposed sectors underperforming. In turn, the index has broken back below its 200DMA to test rising trendline support. As we look ahead, next week will see the Bank of England raise rates for a fifth consecutive meeting. However, while money markets are pricing in 35bps worth of tightening, in light of the Bank’s cautious stance, they are likely to opt for a 25bps rate rise.
FTSE 100 Chart: Daily Time Frame

Source: Refinitiv
| Change in | Longs | Shorts | OI |
| Daily | -30% | 25% | 2% |
| Weekly | -44% | 44% | 0% |
Whether you are a new or experienced trader, we have several resources available to help you; indicator for tracking trader sentiment, quarterly trading forecasts, analytical and educational webinars held daily, trading guides to help you improve trading performance, and one specifically for those who are new to forex.


