


Bitcoin (BTC/USD), Ethereum (ETH/USD), and Alt-Coin Analysis and Charts:
- The cryptocurrency market remains heavy and biased to the downside.
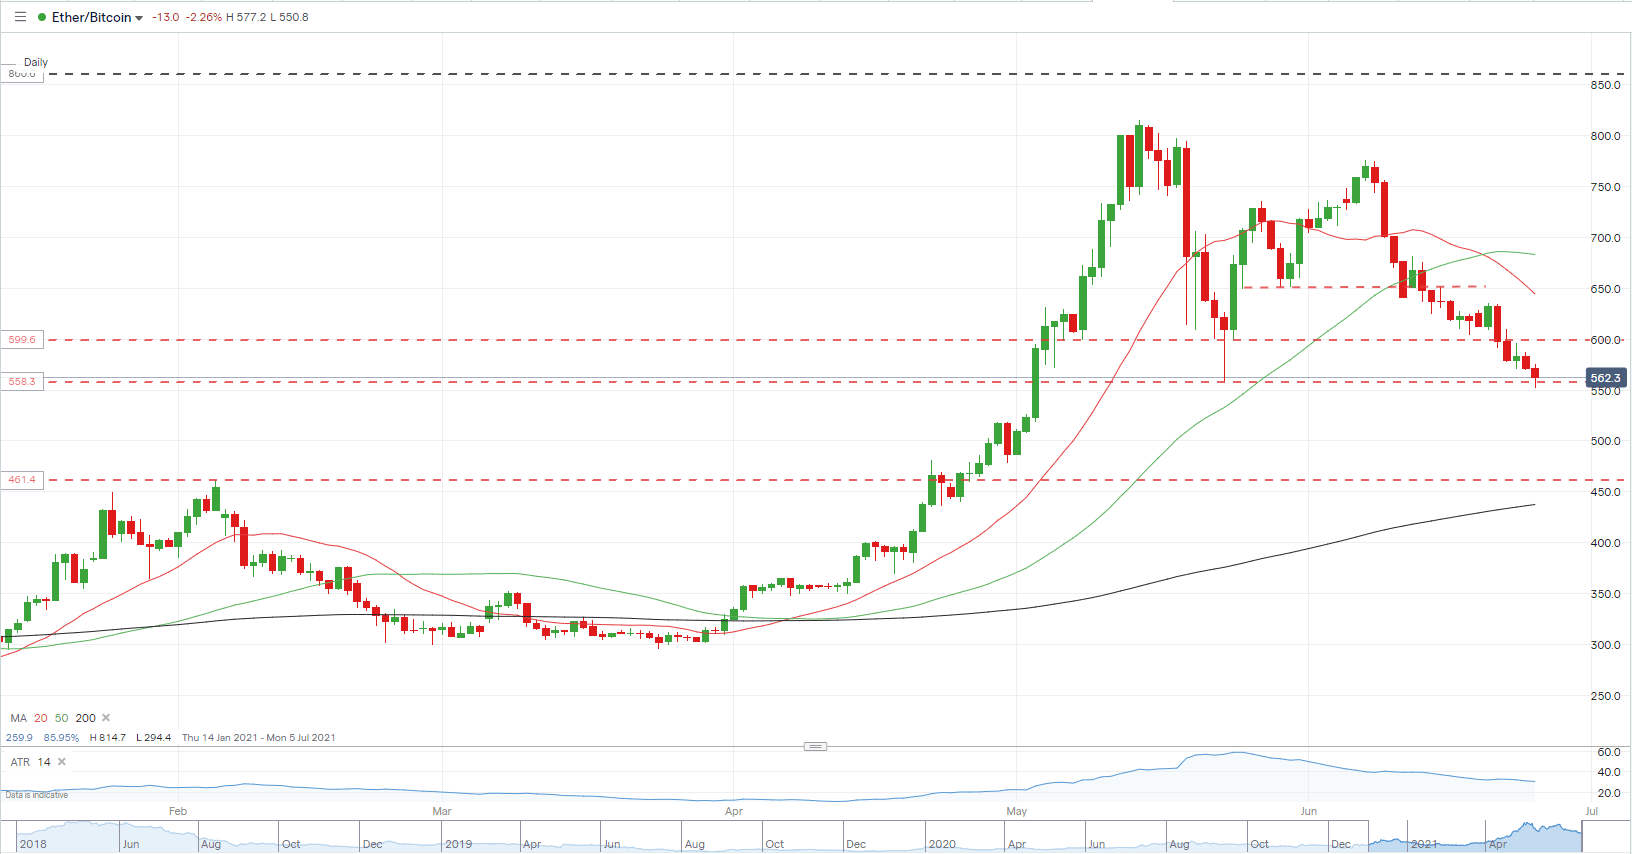
- Ethereum/Bitcoin spread continues to slip lower.

The cryptocurrency market has turned lower again today after a tepid comeback earlier in the week with bears seemingly back in control of price action. Today’s quarterly Bitcoin and Ethereum futures and options expiry may be skewing price action but the overall market tone remains heavy and the charts still suggest lower prices.
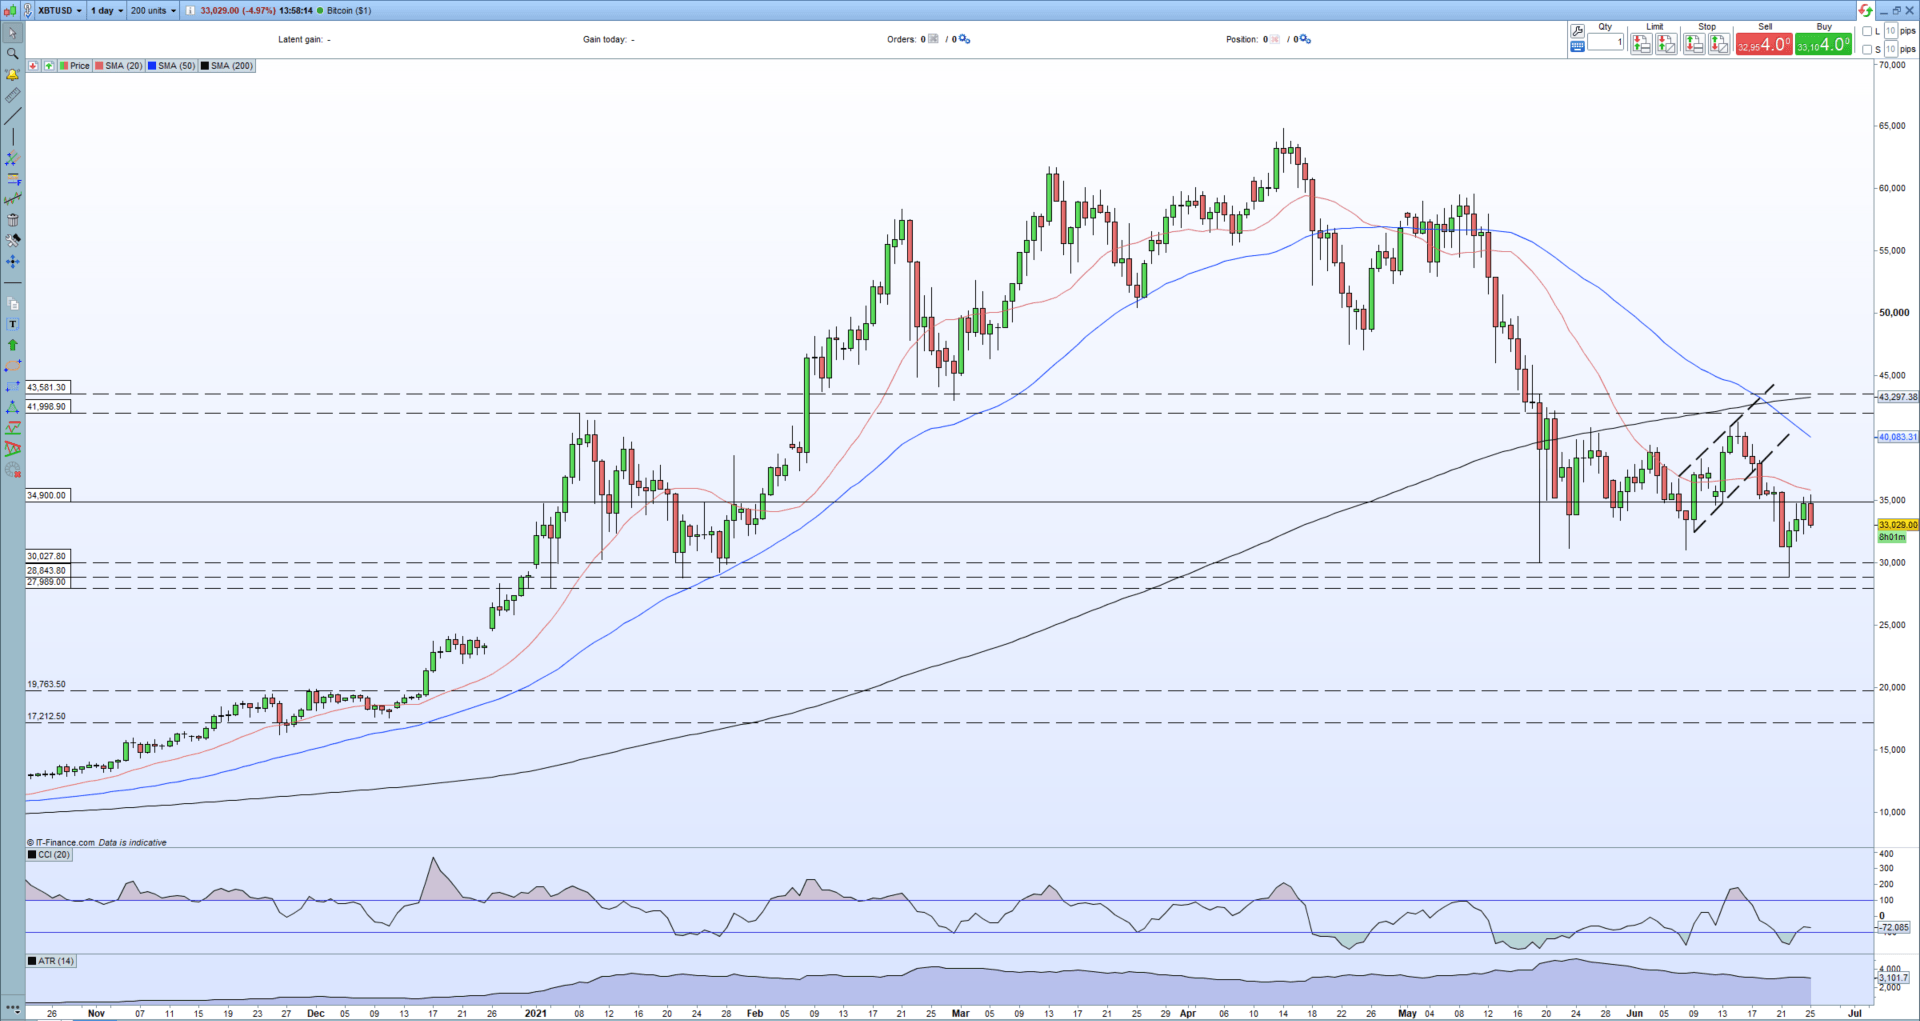
Last Friday’s break of the short-term bull channel saw BTC/USD quickly shed $10,000, printing a multi-month low at $28,843. The subsequent pullback has been tepid with a group of recent highs up to $36,500 now acting as short-term resistance. If BTC can make a confirmed break above here, then the bottom of the recent channel and the bottom of a resistance zone cross is the next likely upside target although this looks likely to be a tough ask at the current time. A support zone between $30k and $28k needs to hold to prevent further heavy losses.
Bitcoin (BTC/USD) Daily Price Chart
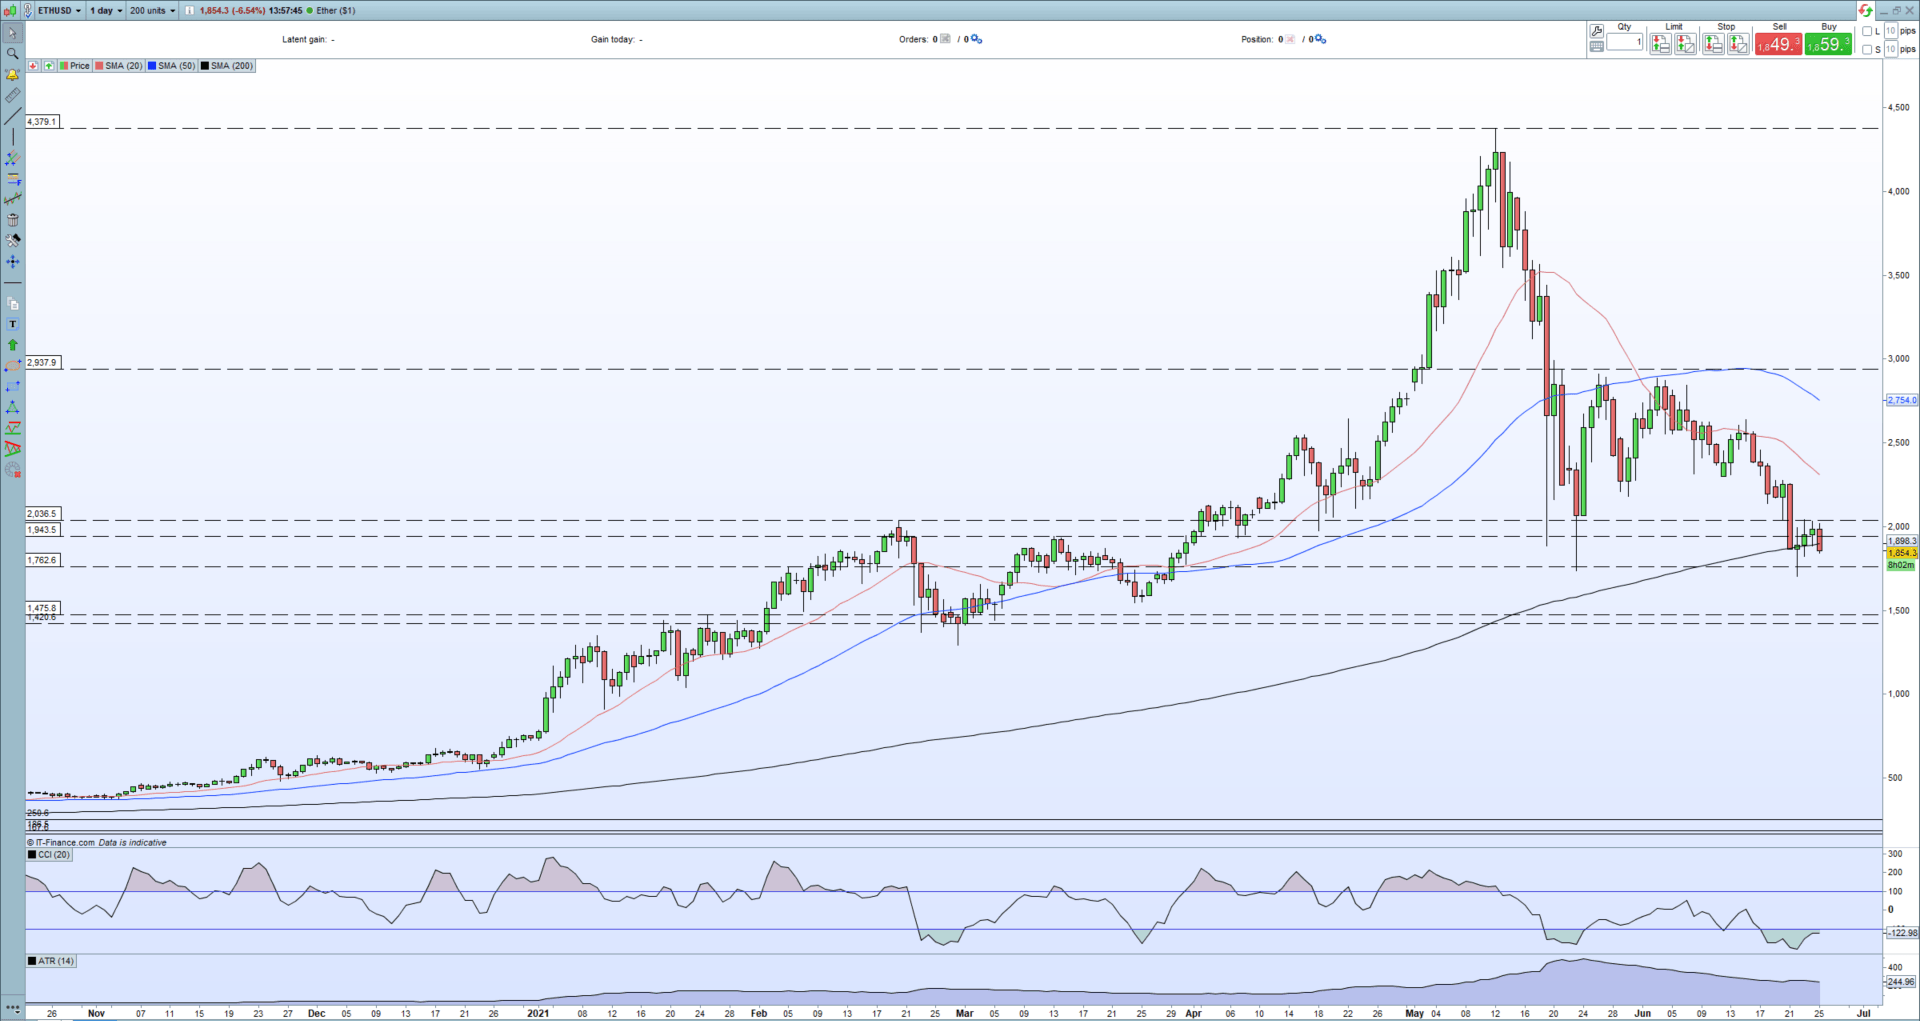
Ethereum’s fall from grace continues with a series of lower highs and lower lows dominating price action from the beginning of June. The CCI indicator suggests ETH is oversold, while the 200-day simple moving average is also being tested, a potentially negative signal if broken. This Tuesday’s low bounced off a level last seen on May 23, a rebound that sent Ethereum back to $3,000 before subsequently selling off. The chart set-up suggests that this may not happen again, especially with all three simple moving averages in line and pointing lower.
Ethereum(ETH) Daily Price Chart
The Ethereum/Bitcoin spread continues to edge lower and is testing a multi-week spike low. The next level of support – from a prior high and a cluster of trades that lead to the secondary rally higher – is around the 460 and this may play out as Bitcoin continues its recent outperformance of Ethereum.
Ethereum/Bitcoin Daily Price Chart
A to Z Crypto: Demystifying the Top Cryptocurrency Jargon
Traders of all levels and abilities will find something to help them make more informed decisions in the new and improved DailyFX Trading Education Centre
What are your views on Bitcoin (BTC),Ethereum (ETH) – bullish or bearish?? You can let us know via the form at the end of this piece or you can contact the author via Twitter @nickcawley1.


