


Equity Analysis and News
Source: Thomson Reuters, DailyFX
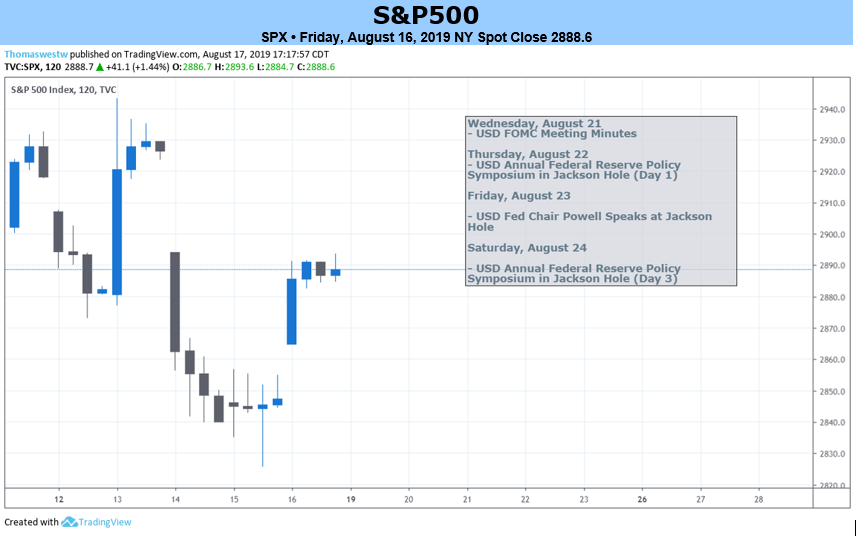
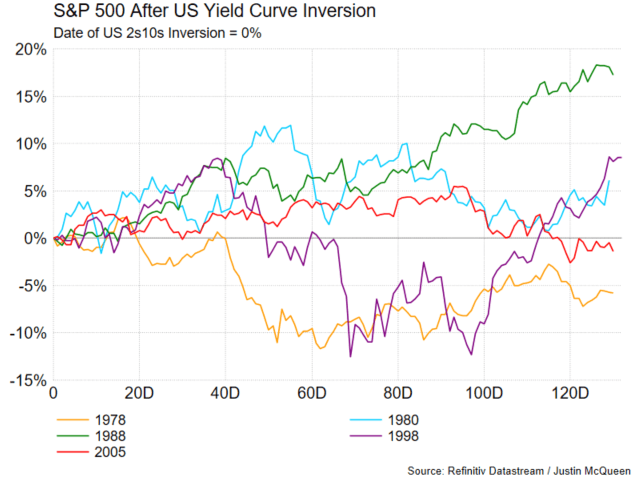
S&P 500 | US Yield Curve Inverts, But Don’t Panic Yet
The ominous sign stemming from the inversion of the US 2s10s provides yet another reminder that the global economic outlook is weakening. However, while the inversion of the yield curve raises the fear of a recession, concerns that it could be imminent is possibly misplaced, given that on average a recession does not take place until 20 months later, while in that time the S&P 500 peaks roughly 24% within that time. Looking ahead to next week, the main focus will be on the Jackson Hole Symposium in which the Fed Chair Powell is schedule to speak (Aug 23rd).
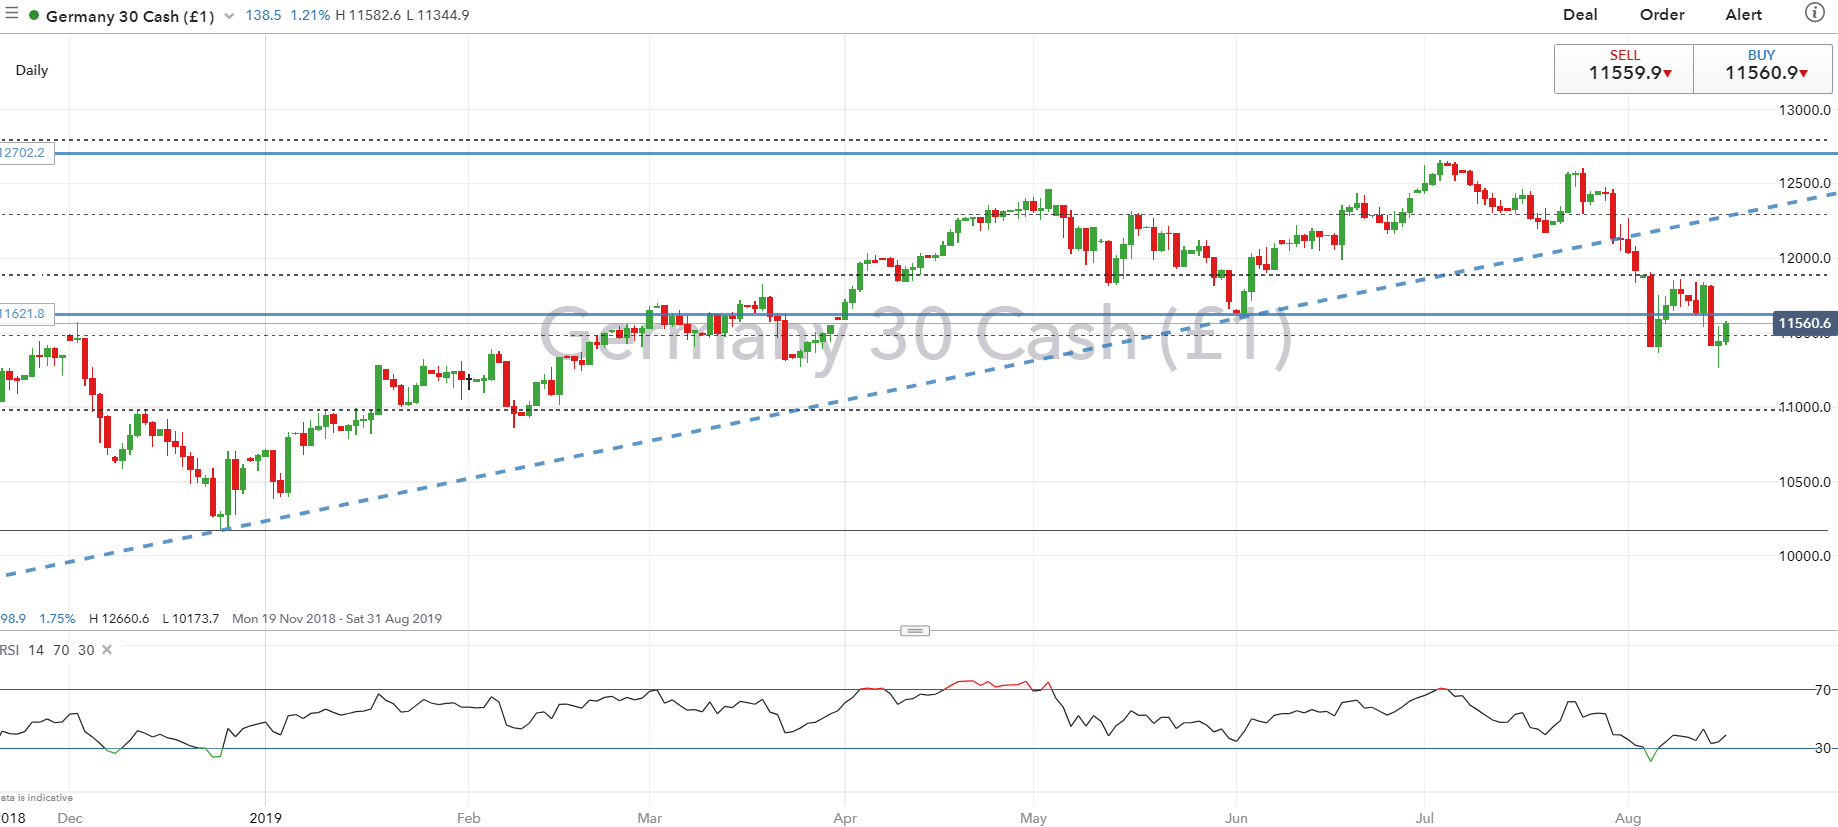
DAX | ECB Member Calls for QE Bazooka
Last week’s ZEW survey and contraction in German growth continued to emphasise the need for ECB stimulus, which has been further alluded to by Olli Rehn, who has called for the central bank to over-deliver. Currently, money markets are pricing in 15bps worth of easing from the ECB, however, the key focus will be on the composition of QE2. Next week sees the release of the Eurozone flash PMIs, which is expected to highlight the ongoing weakness in the manufacturing sector, however, concerns could rise if the weakness spills over into the services sector.
DAX Price Chart: Daily Time Frame (Nov 2018 – Aug 2019)
RESOURCES FOR FOREX & CFD TRADERS
Whether you are a new or experienced trader, we have several resources available to help you; indicator for tracking trader sentiment, quarterly trading forecasts, analytical and educational webinars held daily, trading guides to help you improve trading performance, and one specifically for those who are new to forex.
--- Written by Justin McQueen, Market Analyst
To contact Justin, email him at Justin.mcqueen@ig.com
Follow Justin on Twitter @JMcQueenFX


