


Source: IG Charts
Gold Price (XAU/USD) Analysis, Price and Chart
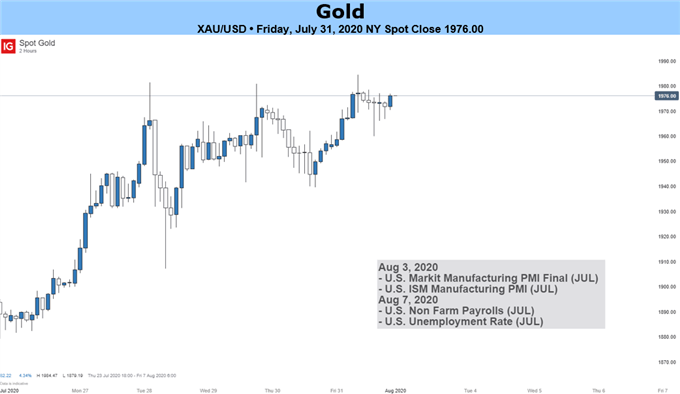
- Gold consolidates just below this week’s record high.
- 10-year US real yields near -1.00%.

Gold printed a fresh new all-time high earlier this week before backing off a fraction as US real yields fell further into negative territory. The latest 10-year data shows US real yields are nearly -1.0%, down from +0.6% in mid-March as the Fed continues to pump US dollars into the system. Gold and US real yields have a strong negative correlation and this continues to hold. US real yields are UST yields less inflation.
Political uncertainty also remains a key driver of gold’s multi-month rally and this is likely to remain the case all the way up to the US Presidential Elections in November, unless President Trump delays them as he suggested in a tweet on Thursday. While this is exceedingly unlikely, it adds another layer of uncertainty to what is already expected to be a very volatile US election period. In addition, and of more immediate concern, the US-China relationship continues to breakdown further and this, along with fears of a full-blown bubble developing in the US stock markets, will underpin any sell-off in gold.
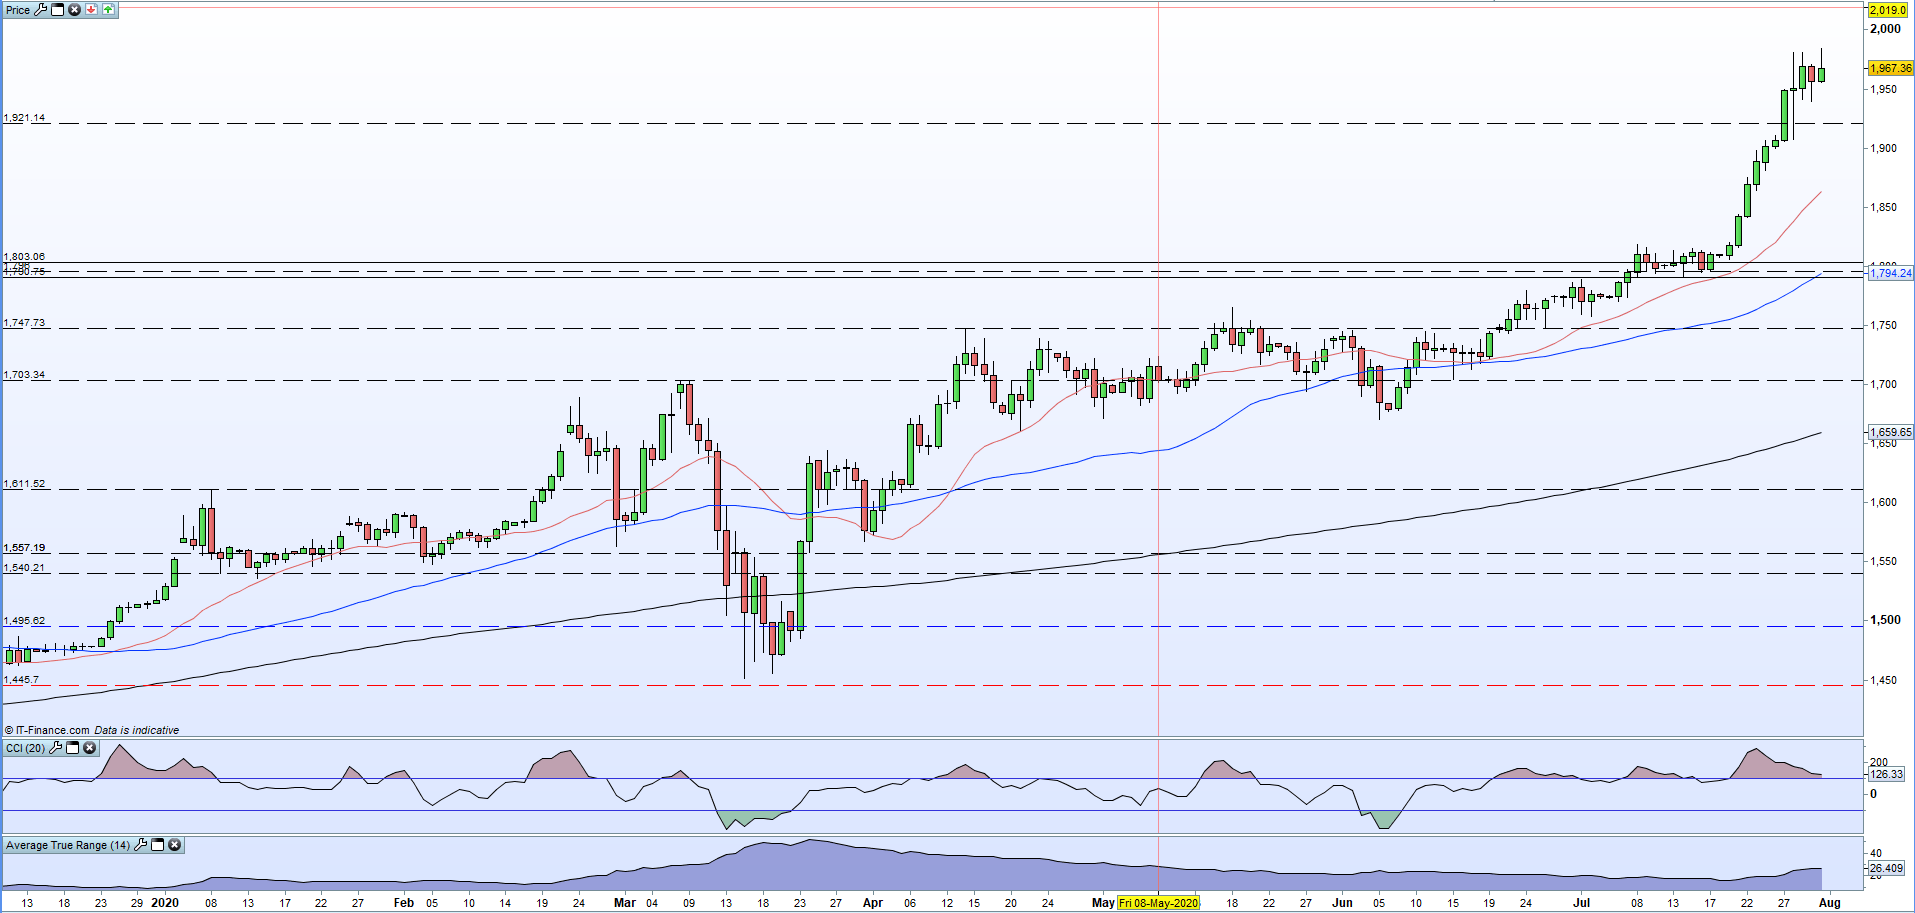
The daily chart shows the gold market became extremely stretched at the end of last week with the CCI indicator showing the market in extreme overbought territory. This set-up is now beginning to ease and while gold remains above $1,906/oz. – last Friday’s high and Monday and Tuesday’s low prints – the outlook remains positive.
Gold Daily Price Chart (December 2019 – July 31, 2020)

What is your view on Gold – are you bullish or bearish?? You can let us know via the form at the end of this piece or you can contact the author via Twitter @nickcawley1.


