
Gold Talking Points
The price of gold trades at its highest level since 2013 following the outbreak of COVID-19, and the weakening outlook for the world economy may keep the precious metal afloat as it fuels bets for monetary support.
Fundamental Forecast for Gold: Bullish
The price of gold holds near the yearly high ($1689) as the coronavirus shows no signs of slowing down, and the precious metal may continue to benefit from the current environment as the shock to the global supply chain spurs speculation for lower interest rates.
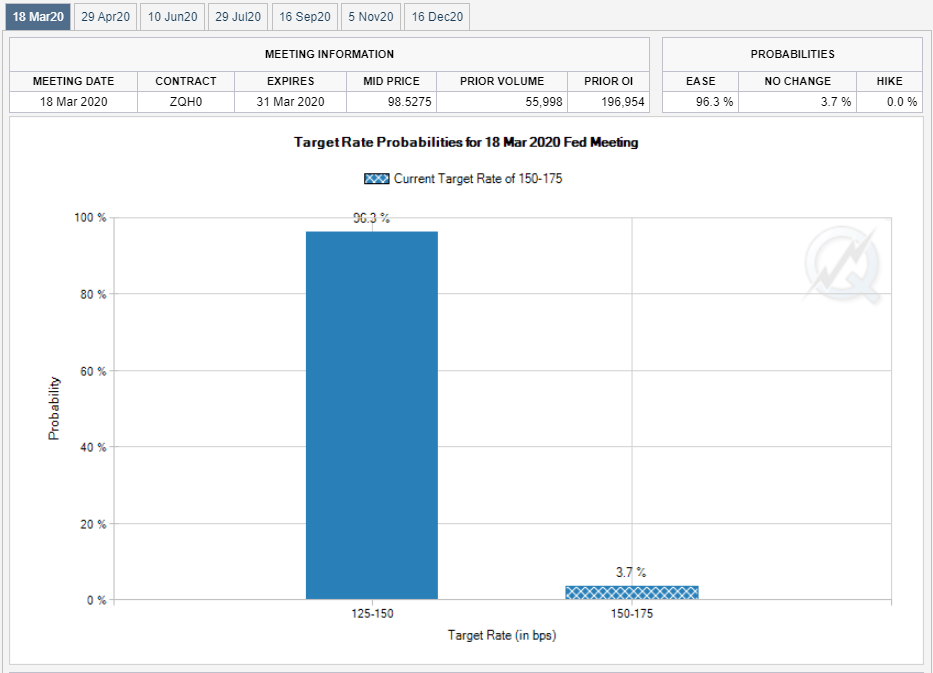
In fact, Fed Fund futures now reflect a greater than 90% probability for a 25bp rate cut on March 18 even though the US Non-Farm Payrolls (NFP) report is anticipated to show the economy adding 195K jobs in February. The threat posed by COVID-19 may force the Federal Open Market Committee (FOMC) to alter the course for monetary policy as former Chair Janet Yellen warns that the outbreak “could throw the US into recession.”
However, recent remarks from Fed Vice Chair Richard Clarida suggest the central bank is in no rush to respond to the coronavirus as the permanent voting-member on the FOMC insists that “the current stance of monetary policy likely will remain appropriate” following the rate easing cycle in 2019.
In turn, Chairman Jerome Powell and Co. may opt to alter the forward guidance when the central bank updates the Summary of Economic Projections (SEP), and Fed officials may utilize the interest rate dot-plot to prepare US households and businesses for a more accommodative stance by forecasting a lower trajectory for the benchmark interest rate.
With that said, speculation for lower interest rates may keep the price of gold afloat as market participantslook for an alternative to fiat-currencies.
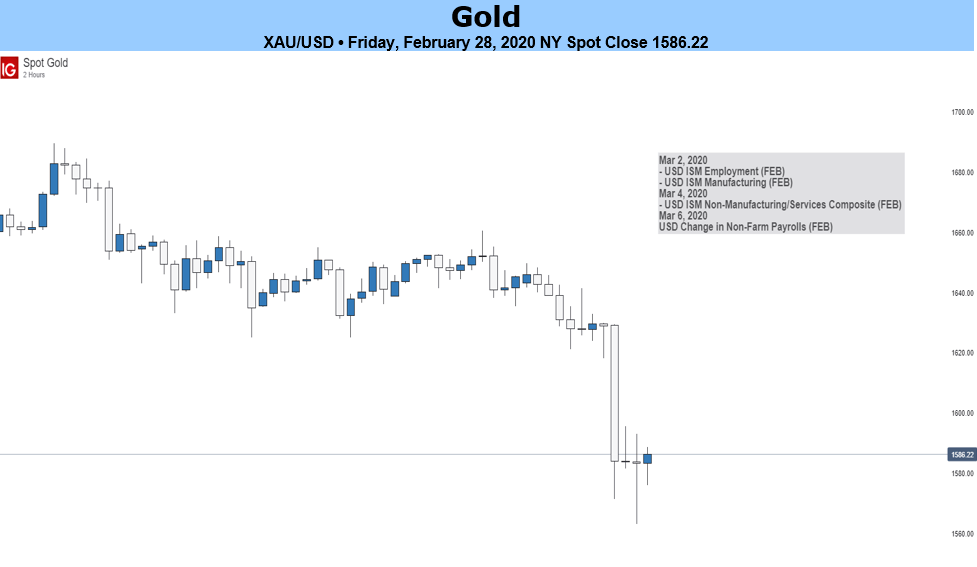
Gold Price Daily Chart
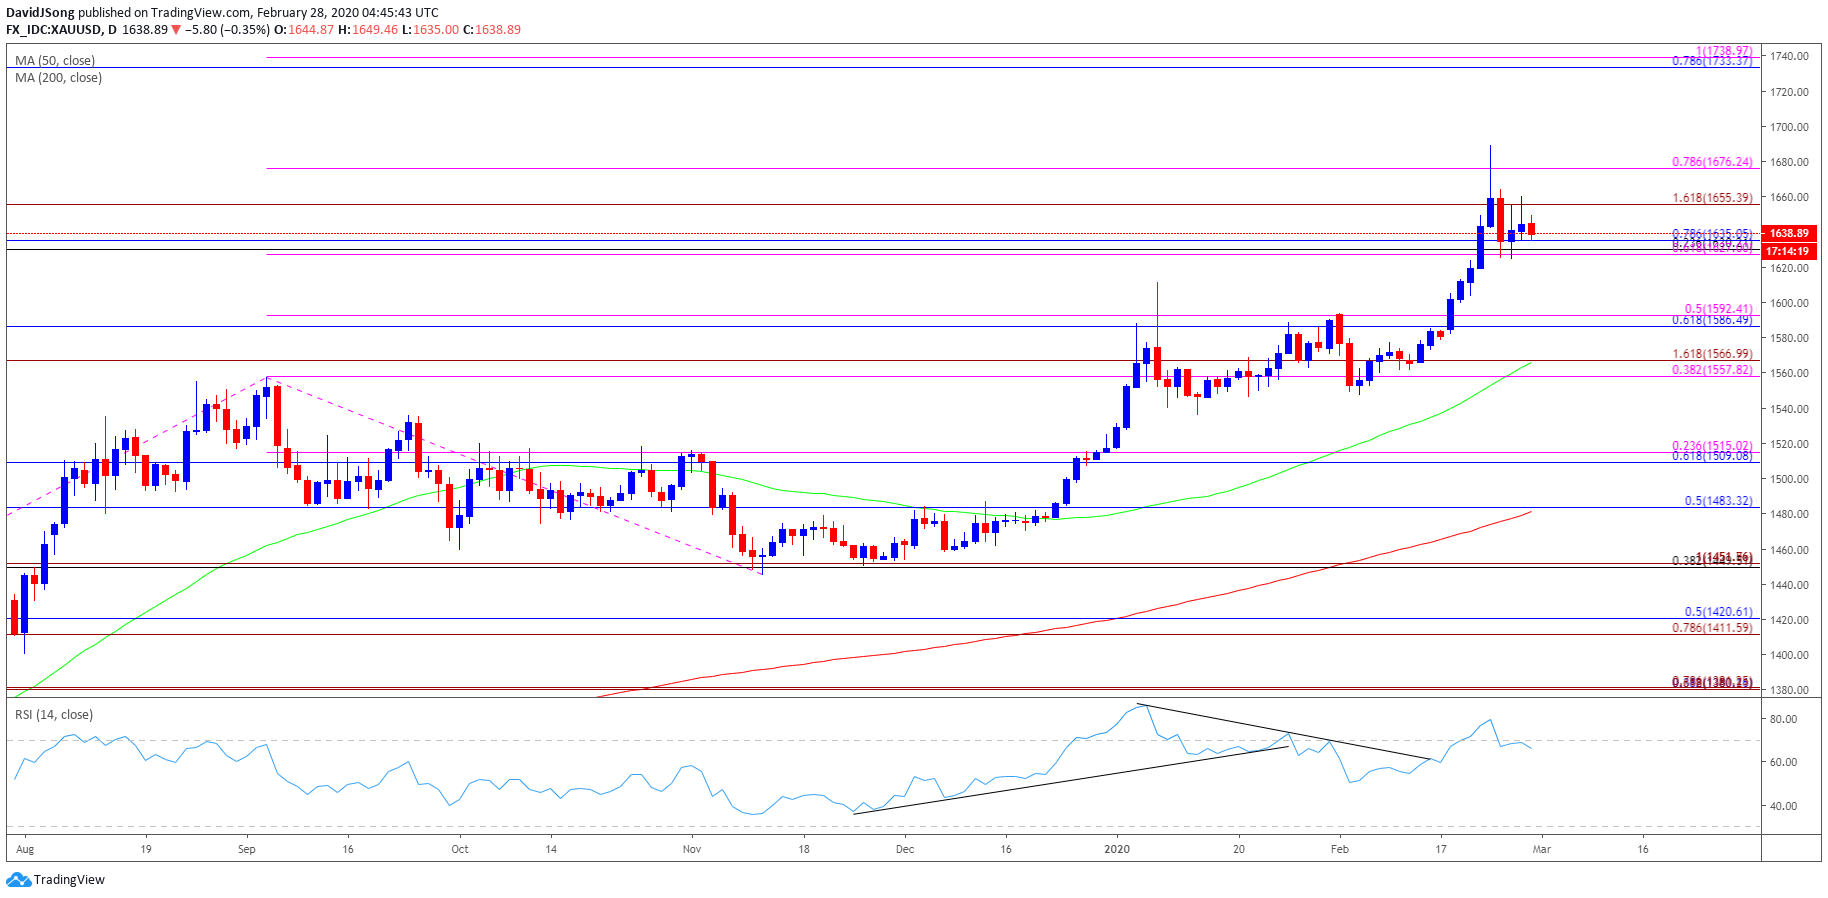
Source: Trading View
The opening range for 2020 instilled a constructive outlook for the price of gold as the precious metal cleared the 2019 high ($1557), with the Relative Strength Index (RSI) pushing into overbought territory during the same period.
A similar scenario materialized in February, with the price of gold marking the monthly low ($1548) during the first full week, while the RSI broke out of the bearish formation from earlier this year to push back above 70.
In turn, the monthly opening range for March is in focus, and the bullish behavior may persist as the RSI on a weekly time frame also pushes into overbought territory.
Need a close above the $1676 (78.6% expansion) region to open up the Fibonacci overlap around $1733 (78.6% retracement) to $1739 (100% expansion).
--- Written by David Song, Currency Strategist
Follow me on Twitter at @DavidJSong