
Fundamental Forecast for Gold: Neutral
Gold Talking Points:
- Gold prices collapse to fresh yearly lows; late-week rebound looks for fuel post-NFPs
- What’s driving gold prices? Review DailyFX’s 2018 Gold Projections
- Join Michael for Live Weekly Strategy Webinars on Monday’s at 12:30GMT to discuss this setup and more!
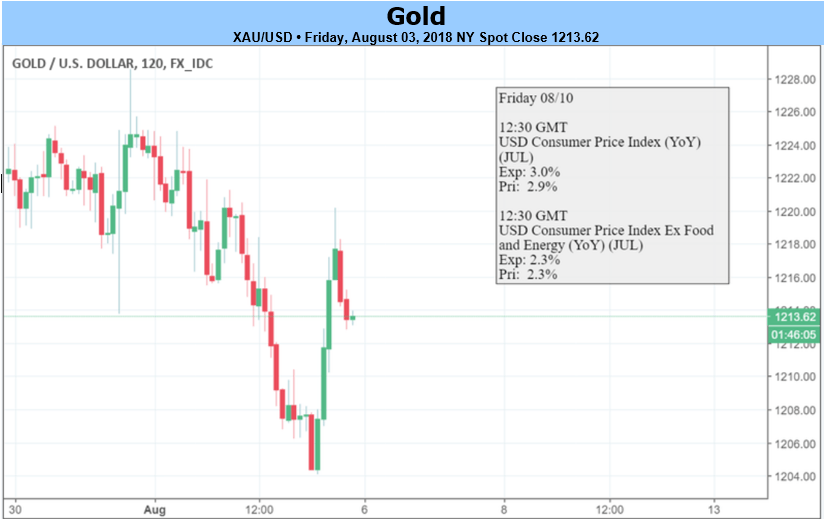
Gold prices are lower for the fourth consecutive week with the precious metal down 0.45% to trade at 1218 ahead of the New York close on Friday. Continued strength in the US Dollar has kept pressure on gold with the DXY trading just below the yearly highs on the back of this week’s FOMC interest rate decision. The decline to fresh yearly lows in gold saw prices respond to a key near-term support range on Friday- but with key US inflation data on tap and rising geo-political tensions at the forefront, can gold prices build on this recent recovery next week?
Gold Bumps Higher on Non-Farm Payrolls
U.S Non-Farm Payrolls (NFP) missed expectations on Friday with a print of 157K – however an upward revision to last month’s read to 248K and a downtick in the unemployment rate to 3.9% overshadows the headline read and continues to highlight underlying strength the labor markets. The release does little to impact the pace of monetary tightening with Fed fund futures still pricing-in rate hikes in September and December (in-line with the central bank’s outlook). The release further fueled a rebound off key support in gold prices with prices rallying more than 1% off the weekly lows.
Looking ahead to next week, traders will be eyeing the release of the July US Consumer Price Index (CPI) with consensus estimates calling for a hold at 2.3% y/y. With employment largely AT the central bank’s ‘natural’ running rate, the focus remains on the inflationary outlook – for gold, a stronger print next week could further fuel expectations that the Fed may need to hasten its normalization process next year (a bearish development for gold which tends to weaken as interest rate expectations climb). From a technical standpoint however, the damage done by the recent breakdown casts a shadow on the near-term price outlook and the focus is on whether price can build on this rebound next week.
New to Trading? Get started with this Free Beginners Guide
Spot Gold IG Client Positioning

- A summary of IG Client Sentiment shows traders are net-long Gold- the ratio stands at +7.06 (87.6% of traders are long) –bearish reading
- Long positions are 2.4% lower than yesterday and 0.1% lower from last week
- Short positions are 0.9% lower than yesterday and 12.2% lower from last week
- We typically take a contrarian view to crowd sentiment, and the fact traders are net-long suggests Spot Gold prices may continue to fall. Traders are less net-long than yesterday but more net-long from last week and the combination of current positioning and recent changes gives us a further mixed Spot Gold trading bias from a sentiment standpoint.
Review Michael’s educational series on the Foundations of Technical Analysis: Building a Trading Strategy
Gold Weekly Price Chart

Last month we noted that, “It’s too risky to begin positioning for a turn, but the threat of a near-term recovery remains evident while above the lower 50-line / 2017 March low-week close at ~1204,” with our expectations for, “side-ways–to-lower price action.” Price dropped into this support zone post FOMC with gold mounting a counter-offensive with the help of NFPs late in the week. So was that it?
Note that weekly RSI is probing a break into oversold territory and IF prices were to close here, the risk would remain weighted to the downside heading into next week from a momentum perspective. That said, look for interim resistance at 1234/36 where the 200-week moving average and the December low converge on the median-line of the broad descending pitchfork formation we’ve been tracking off the 2017 / 2018 highs. A weekly close above this threshold would be needed to suggest that a more significant low is in place. A break lower from here targets subsequent objectives at the 50-line around ~1190s backed closely by a structural support confluence at 1175/80(area of interest for possible exhaustion / long-entries IF reached).
Bottom line: Although the broader risk remains weighted to the downside, gold prices have responded to a major support pivot and could offer a near-term reprieve to the recent selling pressure. The immediate focus heading into next week is on the 1204 support pivot. For a complete technical breakdown of the near-term Gold price levels (daily & intraday), review last week’s XAU/USD Technical Outlook.
What are the traits of a Successful Trader? Find out with our Free eBook !
---Written by Michael Boutros, Currency Strategist with DailyFX
Follow Michaelon Twitter @MBForex or contact him at mboutros@dailyfx.com