


Fundamental Forecast for Gold: Bullish
For only the second time in ten weeks, gold prices finished the week lower. The biggest development of the past week driving gold lower was the Fed’s interest rate expectations. On Monday, Fed Fund futures were predicting a 50% chance of a rate hike at the Fed’s meeting on March 15. As the speeches from Trump and Fed officials rolled in, traders began to believe a rate hike was occurring sooner than later.
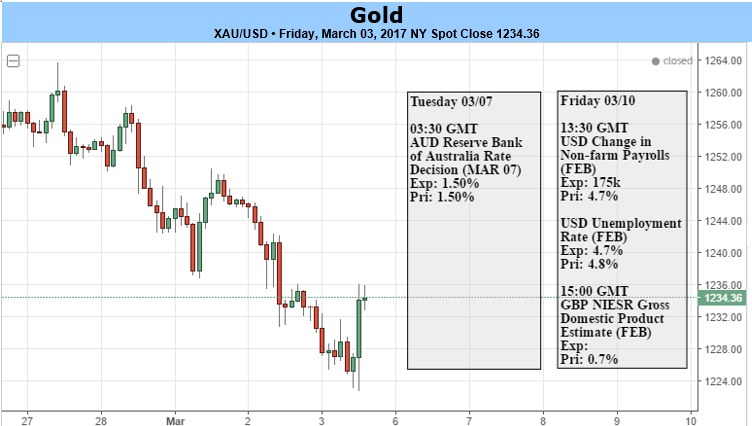
As a result, we saw rate hike expectations swell to 98% on Friday March 3 and gold prices sold off briefly.
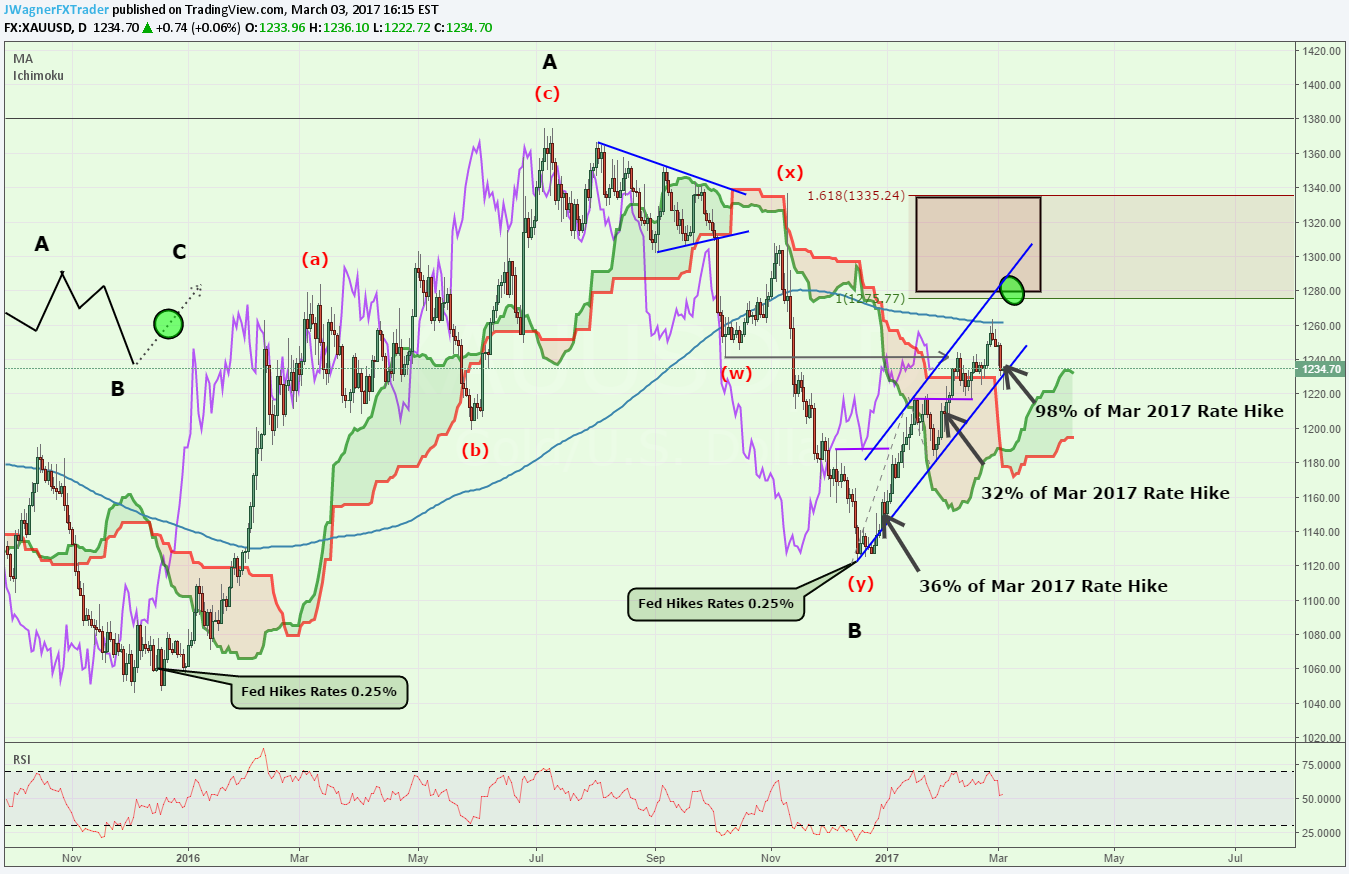
Logic would dictate that a rate hike from the Fed would drive the dollar higher and gold, which yields nothing, lower. That pattern has been seen in the price action of the past couple days. However, if we pan out we can view how the two recent Fed rate hikes were followed by rising gold prices. It is clear from the chart below that increasing rates and even the recent increase in rate hike expectations has driven gold price higher.
Perhaps gold is signaling increasing inflation or that the rate tightening cycle is on hold. Fed Fund futures don’t agree. We will get another glimpse into the US economy this Friday as US Non-Farm Payrolls are released.
We continue to witness bullish technical signals. For example, gold prices have remained inside the Elliott Wave channel (blue). Additionally, price and the Ichimoku lagging line (purple line) remain above the Ichimoku cloud. We have maintained a bullish bias since December 29 when we argued that Gold prices could gain in the face of raising rates.
From a sentiment perspective, Gold’s SSI reading has steadily been decreasing since January 2017. A decreasing SSI suggest bullish undertones for the yellow metal. Gold’s SSI reading sits at +1.58 and you can see live trader positioning on our SSI page.
What is the quarterly outlook for Gold? Find out with our quarterly trading guide.
---Written by Jeremy Wagner
Join me for US Opening Bell webinars on Mondays or Elliott Wave educational webinars on Tuesdays.
Follow me on Twitter at @JWagnerFXTrader .
.


