
The AUD/USD rebound following the 2019 currency market flash-crash has been capped by the 200-Day SMA (0.6909), with the exchange rate staging multiple failed attempts to break/close above the moving average throughout the year.
AUD/USD Daily Chart (Chart 1)
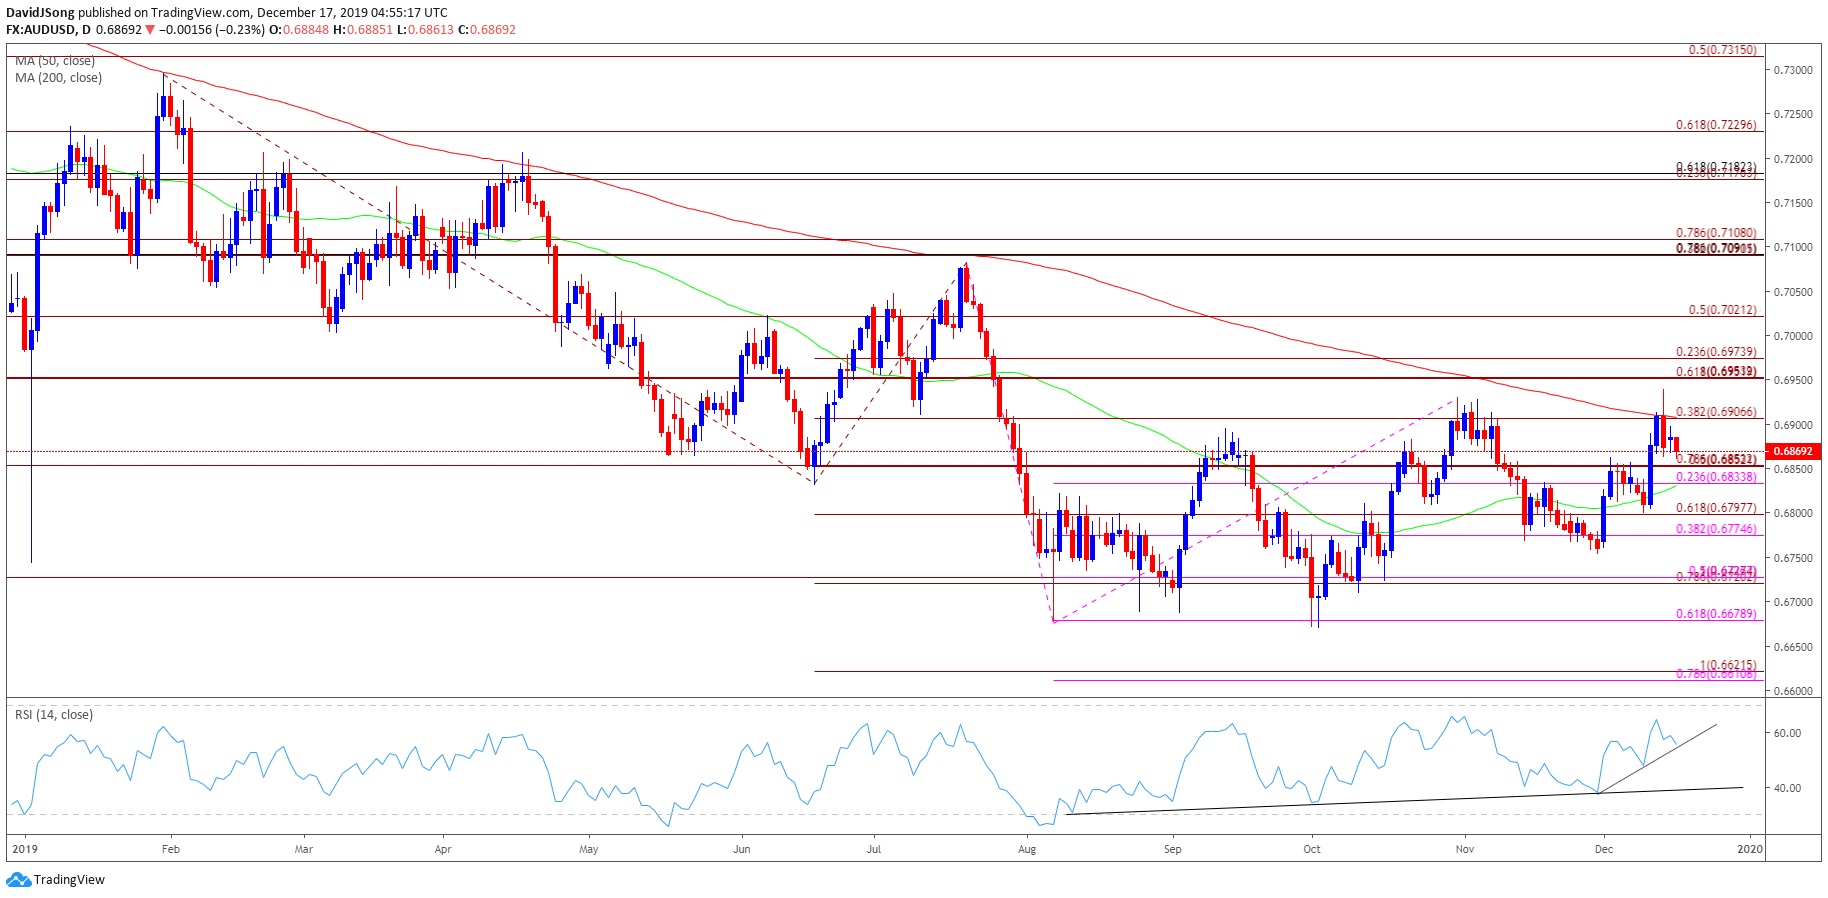
The behavior looks poised to persist in 2020 as a similar scenario takes shape in December. Keep in mind, the negative slope in the simple moving average dates to 2018 when AUD/USD carved a double top formation between September 2017 and January 2018.

Recommended by David Song
Download our Top Trading Opportunities for 2020
--- Written by David Song, Currency Strategist
Follow me on Twitter at @DavidJSong.