


US Dollar, S&P 500,VIX, Nikkei 225, Turkish Lira, USD/TRY, RBA - Talking Points
- The US Dollar has held steady as markets gyrate to risk assessments
- APAC and US equityfutures recover Monday’s losses as sentiment improves
- G-10 currency pairs are forming tight ranges.Will USD resume its uptrend?

The US Dollar has held its strength in the face of rising risks from the spread of the Omicron variant and the uncertainty to the US economy of stimulus measures not being passed by lawmakers.
Wall Street went lower overnight as the US digested news that President Joe Biden’s economic stimulus package has hit some hurdles. This comes at a time that the spread of the Omicron variant is accelerating, and the threat of economic shutdowns become more apparent.
APAC stocks had already gone lower in the Monday session and spent Tuesday recovering, as risk aversion took a breather. Japan’s Nikkei 225 index led Asian bourses higher, trading over 2% higher at one stage.
US equity futures are pointing toward a positive start. The VIX is a futures contract that measures the expected volatility of the S&P 500 over the next 30 days. Not surprisingly, it ticked up overnight as markets sold off. It has since pulled back due to the more positive Asian session today.
Foreign exchange volatility continues to move lower across most currency pairs as holiday markets appear to have started a little early. Liquidity in some markets is already thinning out and if there is a shock to the system, moves might be exaggerated as a result.
However, the Turkish Lira is an exception to this calmer environment. It has seen a wild ride over the last 24 hours. USD/TRY hit a high of 18.3624 yesterday and is now trading near 13.5000.
The recovery of Lira occurred after Turkish President Recep Tayyip Erdogan announced a number of measures to protect domestic retail investors to curb demand for dollars.
In line with the equity markets, US Treasury yields initially went lower in North America, before recovering to be trading near Friday’s close.
RBA meeting minutes were released without too many surprises, as they had followed expectations at the December meeting.
They did consider that the February meeting could see the scrapping of asset purchases altogether if conditions turned out to be better than expected. Alternatively, they looked at tapering again at the February meeting and reviewing it again in May.
Looking ahead, Canadian retail sales data is due out and the current account balance for the US will be released.
Introduction to Technical Analysis
Technical Analysis Tools
Recommended by Daniel McCarthy
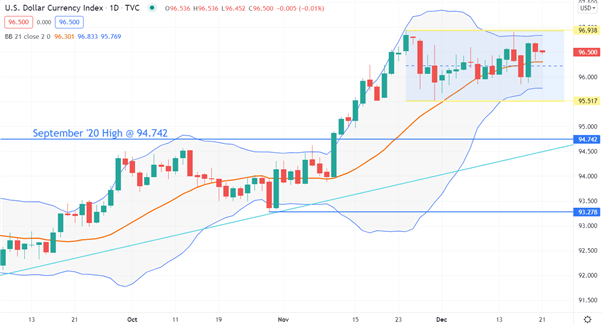
USD INDEX (DXY) TECHNICAL ANALYSIS
After making a new high for 2021 in November, the US Dollar has held onto the rally as it moved sideways within a 95.517 – 96.938 range. These levels may provide support and resistance respectively.
In this consolidation pattern, volatility has been reducing, as shown by the narrowing of the 21-day simple moving average (SMA) based Bollinger Band. A break either side of these bands could see a volatility breakout.
The September 2020 high of 94.742 is now a pivot point and could provide support.
--- Written by Daniel McCarthy, Strategist for DailyFX.com
To contact Daniel, use the comments section below or @DanMcCathyFX on Twitter


