


US Dollar, DXY, Congress, Coronavirus Relief Bill, Russell 2000 – Talking Points:
- The Australian Dollar plunged during Asia-Pacific trade after second quarter GDP confirmed the nations first recession in 29 years.
- The lack of progress in the US Congress’ stimulus talks may put a floor under the US Dollar.
- Russell 2000 Index teetering at post-crisis highs as bearish divergence hints at impending correction.
Asia-Pacific Recap
The haven-associated US Dollar clawed back lost ground during Asia-Pacific trade on the back of the largest expansion in US manufacturing activity in two years. ISM manufacturing PMI for August surged to 56, smashing the consensus of 54.5.
The Australian Dollar plunged after second quarter GDP confirmed that the nation had entered its first recession in almost 30 years.
Gold dipped back below $1,970/oz as US 10-year Treasury yields rose just over 1 basis point.
Looking ahead, speeches from several members of the Federal Reserve headline the economic docket alongside US ADP employment data for August.
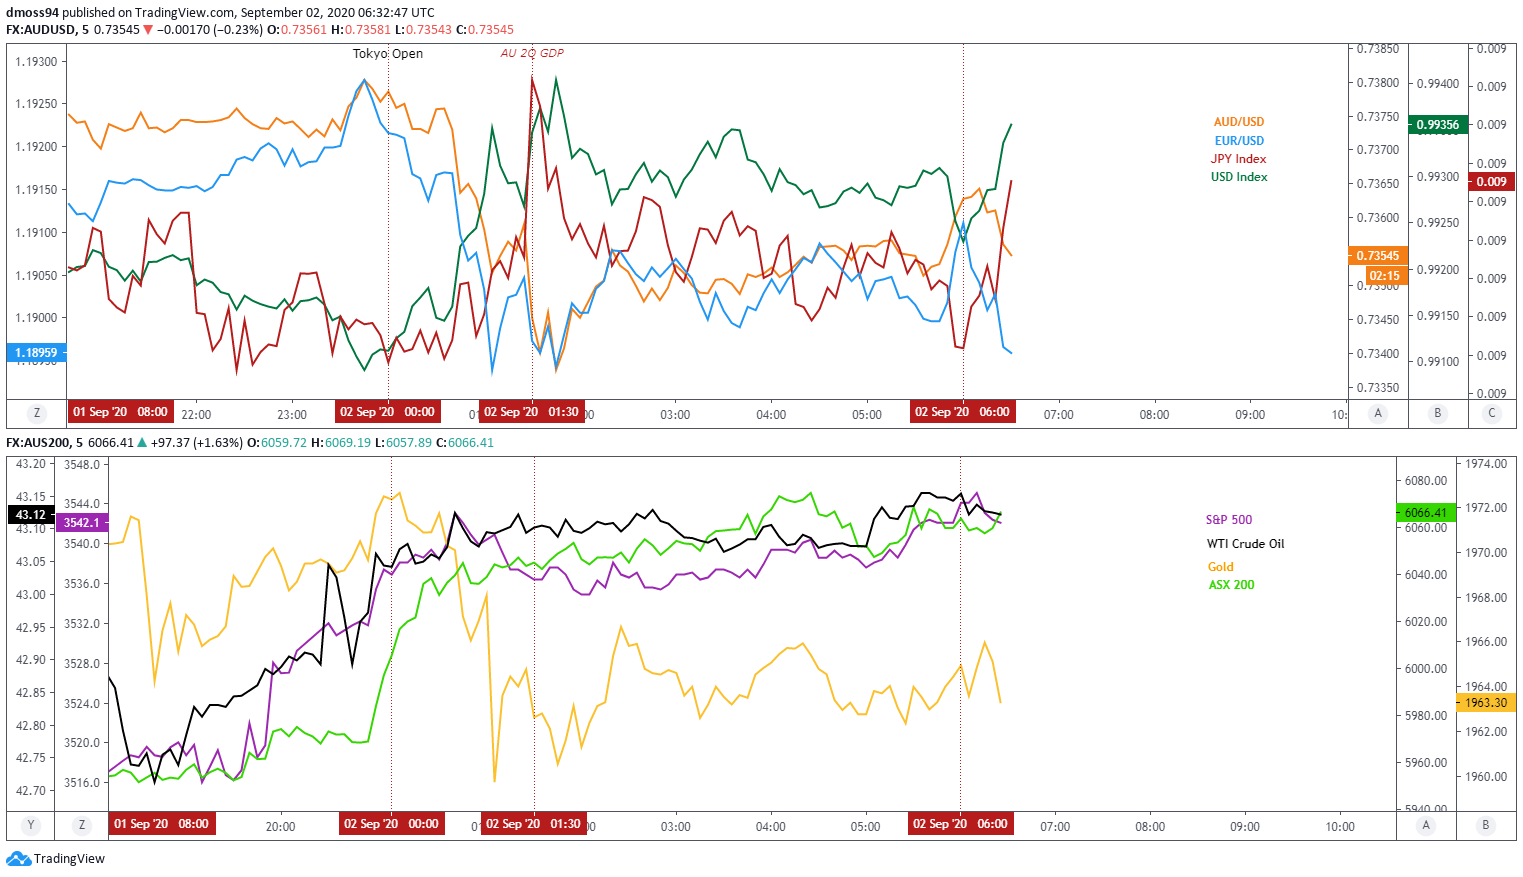
Market reaction chart created using TradingView
Stimulus Impasse May Underpin USD
The relentless US Dollar selling seen in the last 6 months may fade ahead of the Federal Reserve’s monetary policy meeting on September 16, as focus shifts to the prolonged Congressional impasse preventing the provision of much needed fiscal stimulus.
House Speaker Nancy Pelosi and Treasury Secretary Steven Mnuchin’s phone call on Tuesday appeared to highlight the “serious differences” that remain between both sides of the aisle, with Pelosi stating that “this phone call made clear that Democrats and the White House continue to have serious differences understanding the gravity of the situation that America’s working families are facing”.
The stalemate looks set to continue despite White House Chief of Staff Mark Meadows stating that President Donald Trump would be willing to sign a $1.3 trillion relief bill on Friday, as Democrats refuse to budge lower than the already reduced $2.2 trillion. Pelosi compromised on the originally proposed $3 trillion in August to get a deal across the finish line.
US Mobility Data
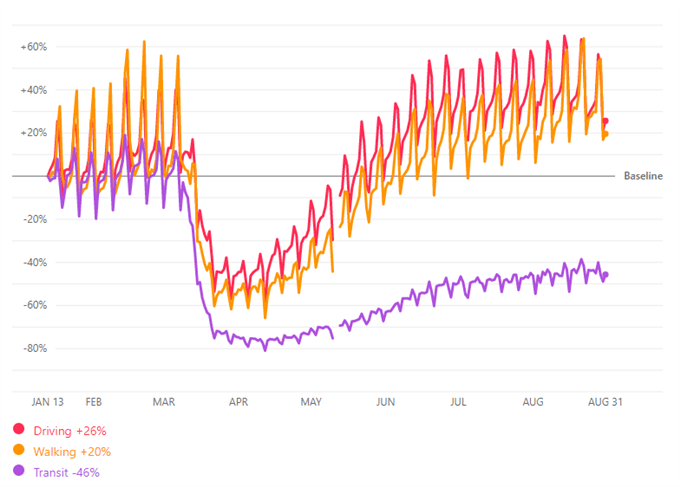
Source – Apple Mobility Data
Glancing at high-frequency data it seems evident that the US recovery from the doldrums of March is beginning to run out steam, as all three mobility data points – driving, walking and transit – have notably levelled off in the last 4 weeks.
Moreover, with initial and continuing jobless claims hovering at levels almost 3 times higher than the peak seen during the 2008 global financial crisis and cases of Covid-19 in the US surging past 6.06 million, the need for fiscal stimulus may intensify in the coming weeks.
To that end, lack of progress on coronavirus relief bill negotiations could trigger a short-term resurgence of risk aversion and in turn underpin the Greenback against its major counterparts.
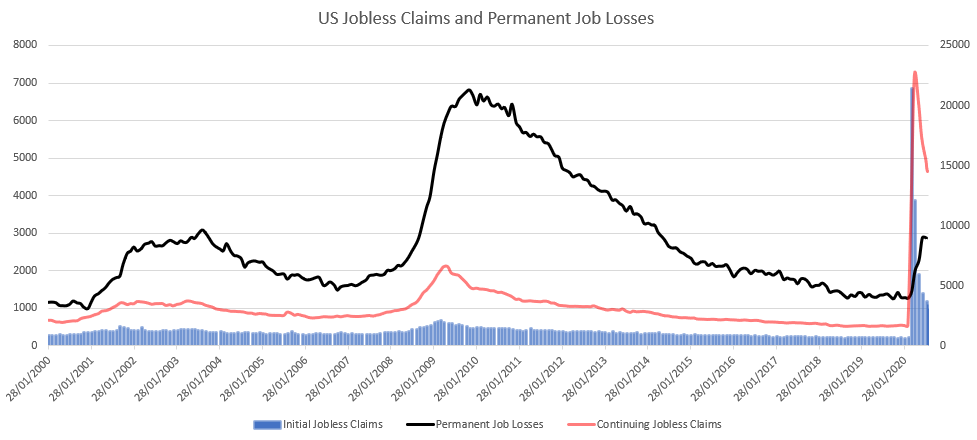
Data Source - Bloomberg

US Dollar Index (DXY) Daily Chart – Flag Support Holds…..For Now
From a technical perspective, the US Dollar index seems to be gearing up for a push back towards the 21-day moving average (92.93), as the RSI clambers out of oversold territory and price fails to close below Bear Flag support at the August 18 low (92.13).
A bullish cross-over on the MACD indicator hints at swelling bullish momentum that could generate a recovery back to test confluent resistance at the flag midpoint and Descending Channel parallel.
That being said, the long-term outlook for the Greenback remains tilted to the downside given price sliced through 9-year trend support at the end of July and continues to consolidate in a bearish continuation pattern.
Therefore, further losses could be in the offing if price fails to overcome resistance at the July low (92.55) and 21-DMA (92.93), with a daily close below the August 18 low (92.13) probably signalling the resumption of the primary downtrend.
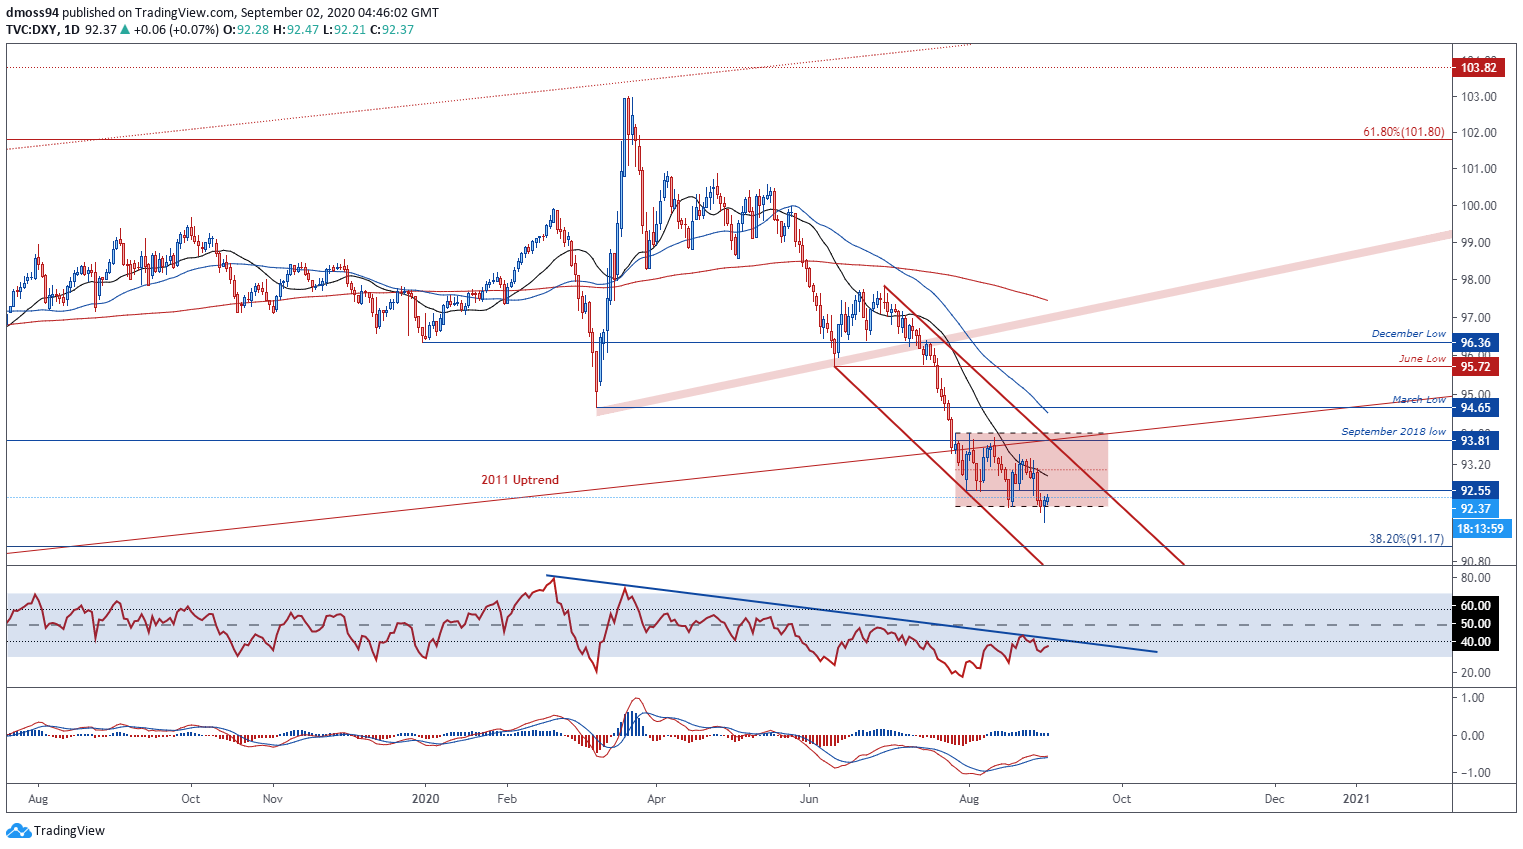
DXY daily chart created using TradingView
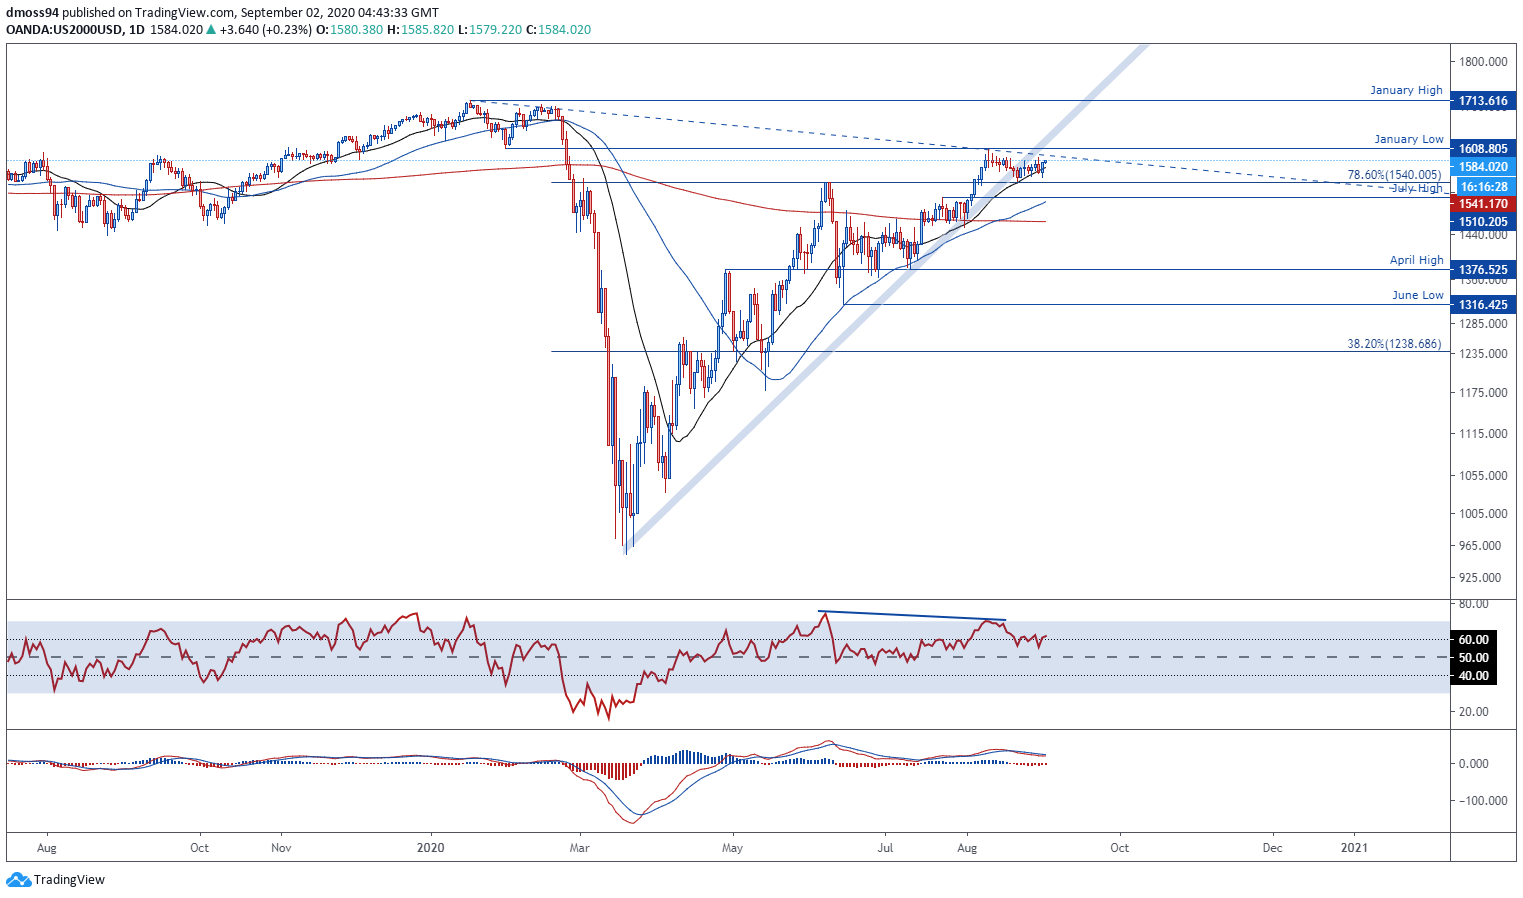
Russell 2000 Daily Chart – Breakdown or Continuation?
Bearish RSI divergence and a series of Doji and Hammer candles just shy of the psychologically imposing 1600 level suggest the Russell 2000 index’s recovery from support at the 78.6% Fibonacci (1540) could be running out steam.
However, the break of the uptrend extending from the March low (953.77) failed to generate any follow through and may be indicative of swelling bullish momentum, as the MACD indicator continues to travel in positive territory.
With that in mind, a daily close above the January low (1608.81) is needed to validate bullish potential and carve a path to test the January high (1713.62).
Conversely, a break back below the 78.6% Fibonacci (1540) would probably result in price falling back towards confluent support at the 100-DMA and July high (1510.20), with a break below bringing the sentiment-defining 200-DMA into play (1463).
Russell 2000 index daily chart created using TradingView
-- Written by Daniel Moss, Analyst for DailyFX
Follow me on Twitter @DanielGMoss


