


.JPG)

EU Stoxx 50 Index, Economic Surprise Index, German Bunds – Talking Points:
- Equity markets drifted lower during APAC trade as investors continue to monitor US fiscal stimulus package negotiations.
- Robust economic data out of the EU may buoy regional risk assets.
- EU Stoxx 50 carving out Ascending Triangle pattern just shy of key resistance.
Asia-Pacific Recap
Equity markets drifted lower during Asia-Pacific trade, as the ASX 200 plunged 1.36% despite better-than-expected Australian jobs data.
Gold and silver climbed higher on the back of falling bond yields, whilst the US Dollar extended its slide against its major counterparts.
The New Zealand Dollar declined after the island-nation announced a further 15 cases of the novel coronavirus, after recording its first case in over 100 days on August 11.
Looking ahead, jobless claims data out of the US may prove market-moving as investors continue to monitor US fiscal stimulus negotiations.
Positive EU Fundamentals Firming Market Sentiment
Positive economic data out of the Euro-area looks to have directed capital flows back into regional equity markets, after climbing Covid-19 cases at the tail-end of July seemed to spook market participants.
The resulting absence of risk appetite weighed on the performance of the EU Stoxx 50 index, as it retreated from its post-crisis high on July 21 (3445) back to the 3160 level at the end of last month.
However, the start of August brought with it better-than-expected fundamental data, as manufacturing PMI for the Euro-zone pointed to the trading bloc’s first month of expansion since early 2019 and year-on-year retail sales showed a 1.3% jump in June.
The surprising improvement in EU fundamentals was reflected in the Citi Economic Surprised Index, as it climbed to its highest levels since 2005 earlier this month.
Given the current trend of economic data surprising to the upside, further gains may be on the table for regional risk assets as market participants look ahead to the EU’s GDP and employment data release for the second quarter of 2020.
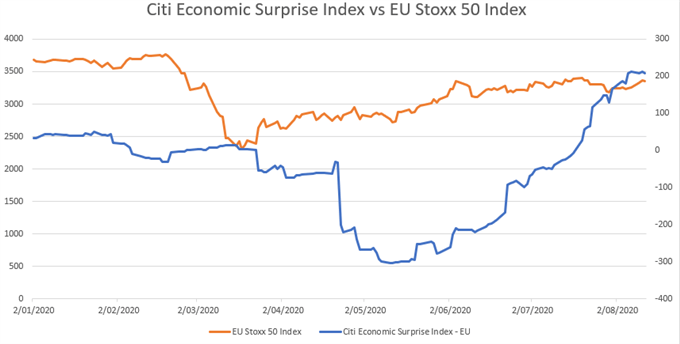
Source - Bloomberg
German 10-Year Bunds Daily Chart – Trend Break Hints at Improving Market Sentiment
From a technical perspective, Europe’s go-to ‘safe haven’ asset – German 10-year Bunds – seem poised to extend recent declines after breaking through uptrend support extending from the June low (102.58).
A bearish cross-over on the MACD indicator, combined with the RSI snapping its two-month uptrend, may intensify selling pressure and possibly result in price sliding back to support at the July low (103.99).
With that in mind, a continuation of the corrective move may be reflective of improving market sentiment and would probably coincide with a marked appreciation in risk-sensitive assets.
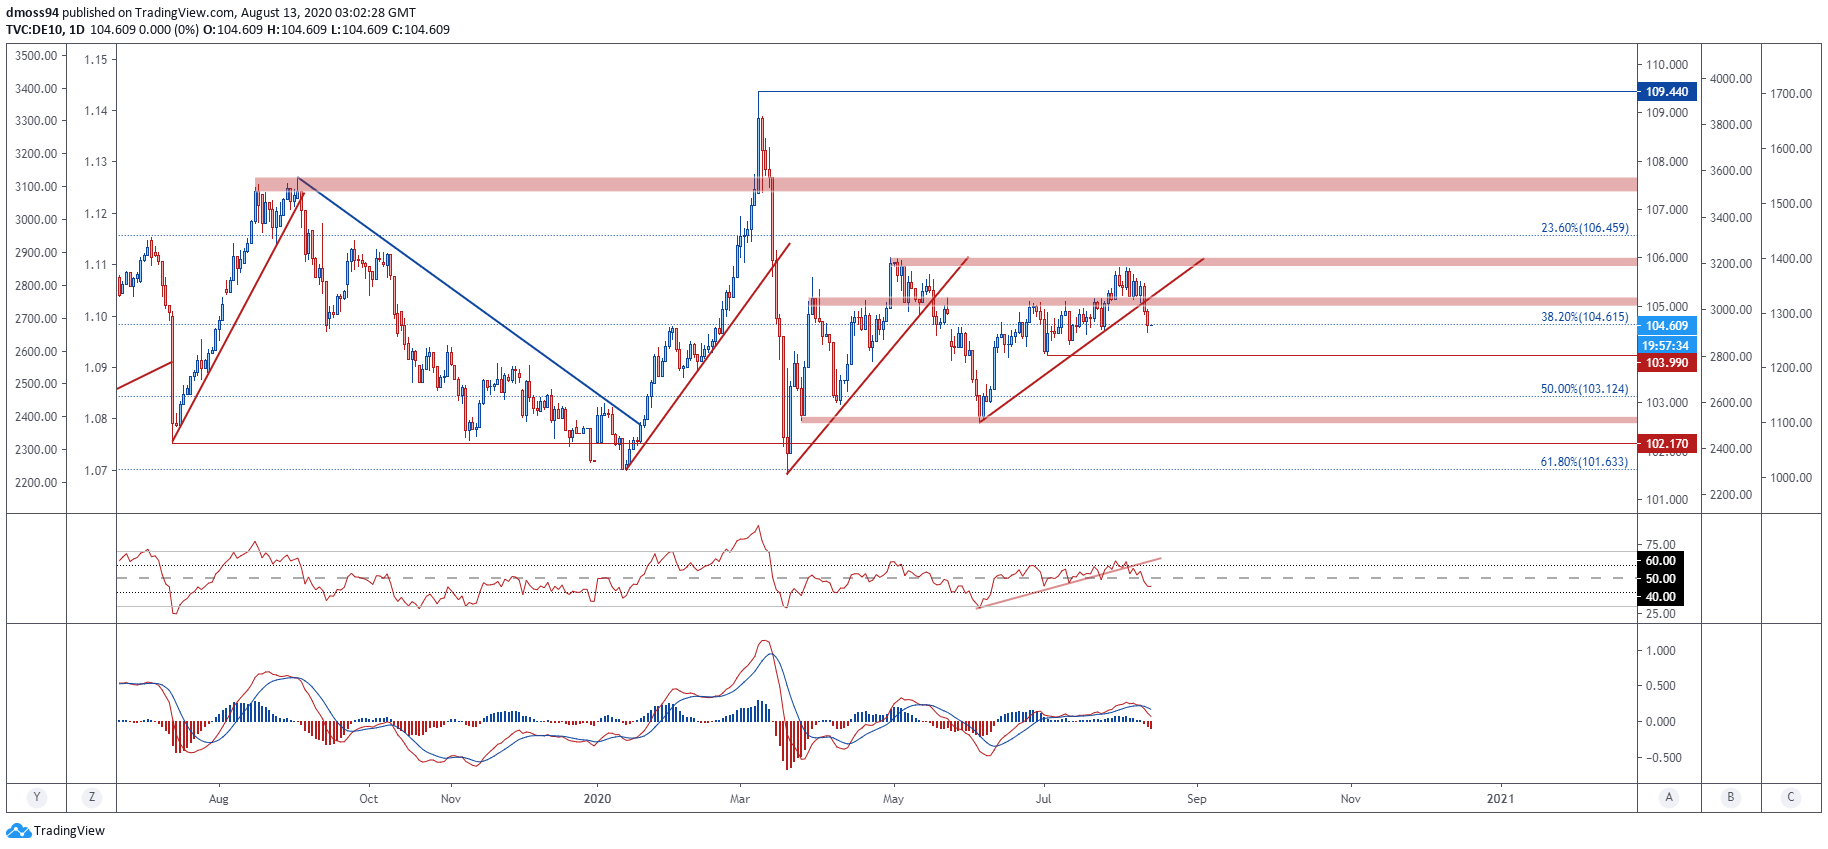
German Bunds daily chart created using TradingView
EU Stoxx 50 Daily Chart – Ascending Triangle in Play
The path of least resistance for the EU Stoxx 50 index appears to be to the topside, as price remains constructively perched above the sentiment-defining 200-day moving average (3323).
With price carving out a potential Ascending Triangle continuation pattern just shy of the March high (3467), an impulsive break higher looks in the offing.
Moreover, buying pressure may intensify as the MACD indicator crosses above its signal line and the RSI climbs back above its neutral midpoint.
Having said that, the slope of the trend-defining 50-DMA (3276) has notably flattened out in recent days and may be reflective of fading bullish momentum.
Therefore, a short-term pullback to the 61.8% Fibonacci (3243) could eventuate in the coming days, if price struggles to break above psychological resistance at the 3400 level and sellers overcome mobile support at the 200-DMA (3323).
On the other hand, a daily close above the March high is needed to validate a break of the Ascending Triangle pattern and could open a path for price to climb to test the January high (3607).
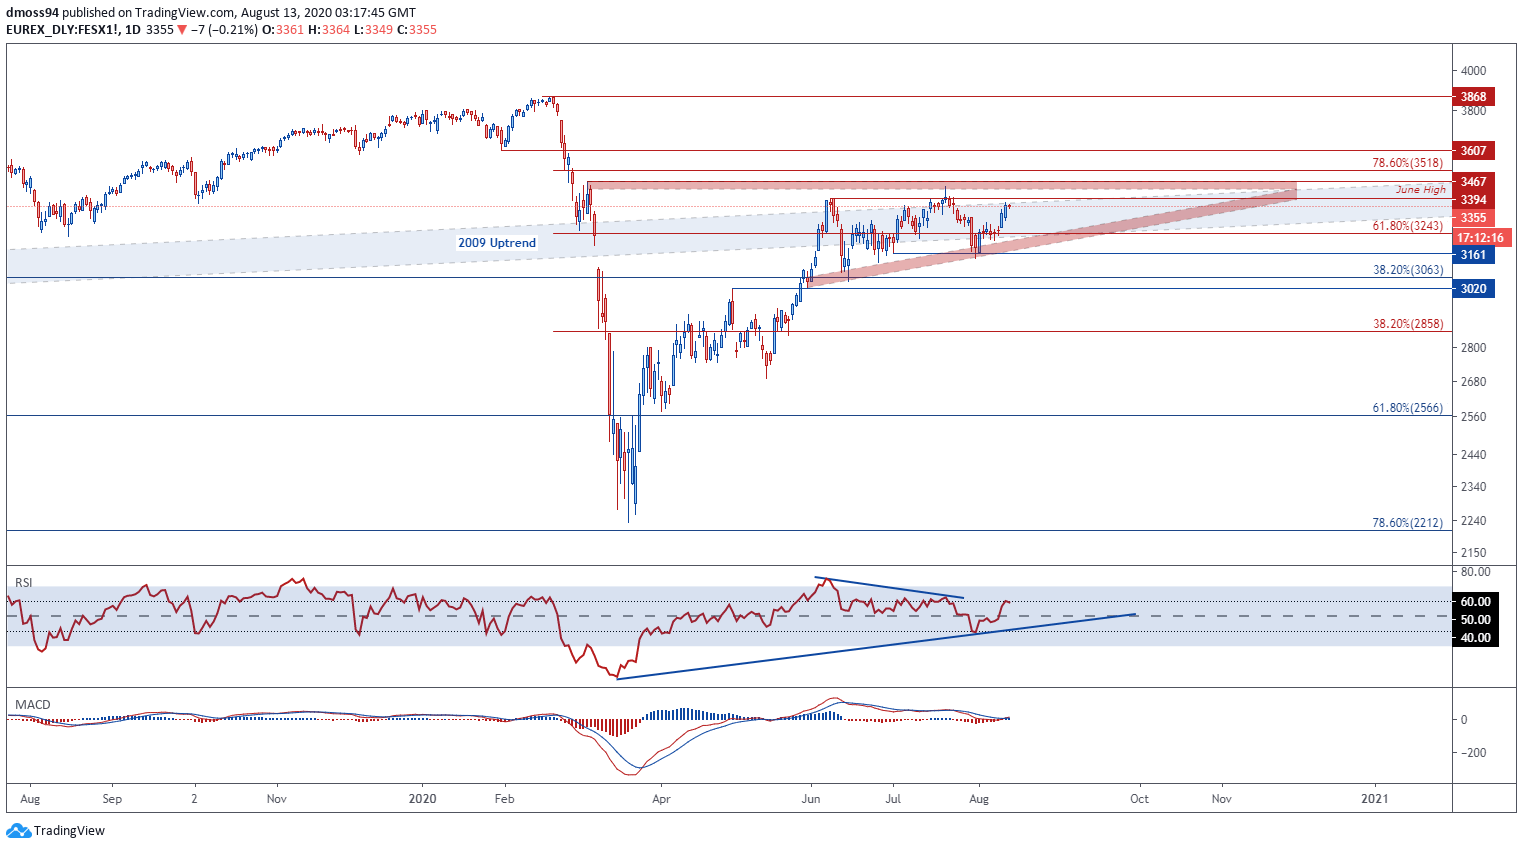
EU Stoxx 50 Index daily chart created using TradingView
-- Written by Daniel Moss, Analyst for DailyFX
Follow me on Twitter @DanielGMoss


