


Gold Talking Points:
- Gold prices just finished a third week of digestion after a strong spike developed in the month of March.
- As looked at in this week’s forecast, the door was wide open for Gold bears with surging US yields and a number of bearish formations on the Gold chart over the past few weeks. But they’ve continually failed to take advantage of the scenario and this may bring on bullish potential.
- The analysis contained in article relies on price action and chart formations. To learn more about price action or chart patterns, check out our DailyFX Education section.

Gold prices have just pushed up for a fresh four week high after this week’s open, and this threatens to end an impasse that showed up after a busy start to the month of March.
Russia invaded Ukraine on February 24th, and this provided a jolt to Gold prices as the yellow metal pushed up for a yearly high at 1976. This is a level that we’ll be coming back to, but after that spike a pullback developed that was heavily bid, driving Gold back above the $2,000 psychological level in early-March trade. This came very close to the prior all-time-high set in the summer of 2020 but fell about $10 short of that high water mark.
That led to a strong pullback the following week which built an evening star formation. Such formations are often indicative of topping and will be followed with the aim of bearish reversals. Given the failed run at the prior high combined with the candlestick formation, this made for a bearish backdrop in Gold.
There was but one problem: Support. That support had come-in from a very familiar area, spanning from the psychological level of 1900 up to the prior all-time-high of 1923.70. The following week, sellers were unable to break through and the same thing showed for the next two weeks, leading to a round of digestion that may finally be nearing some resolution in Gold.
Gold Daily Price Chart
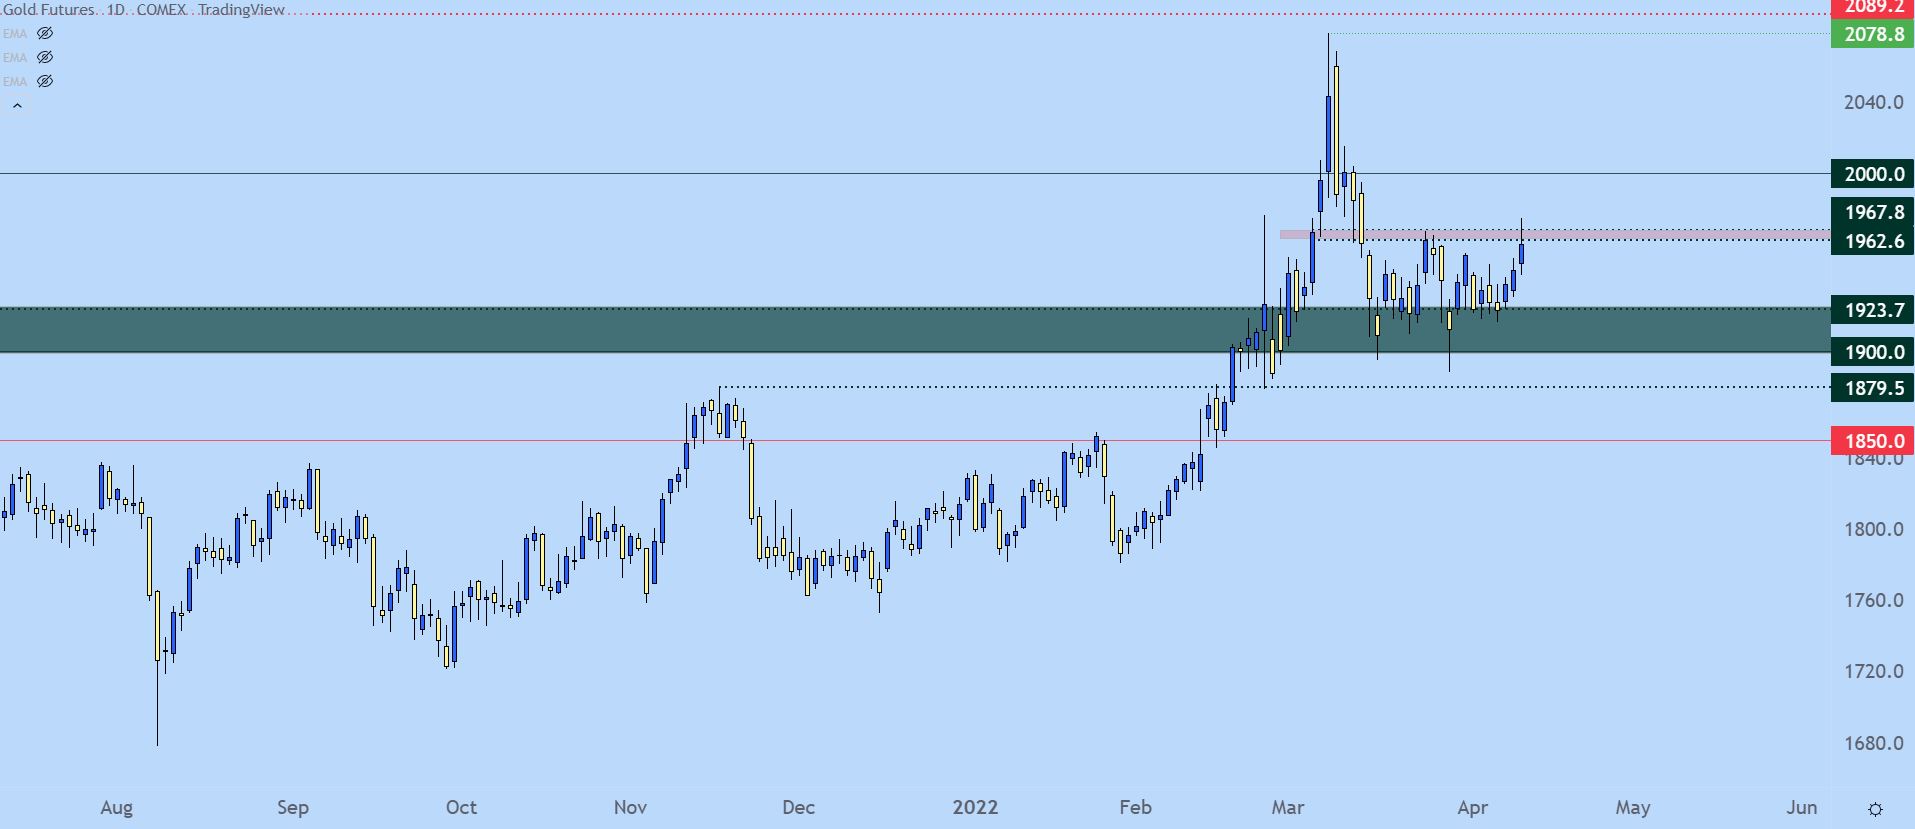
Chart prepared by James Stanley; Gold on Tradingview
Gold Longer-Term
Taking a step back on the monthly chart highlights how relevant this current zone of support is for Gold. The prior all-time-high of 1923.70 held for almost a full decade before the breakout of summer 2020 finally tested through the 2k level.
Gold Monthly Price Chart
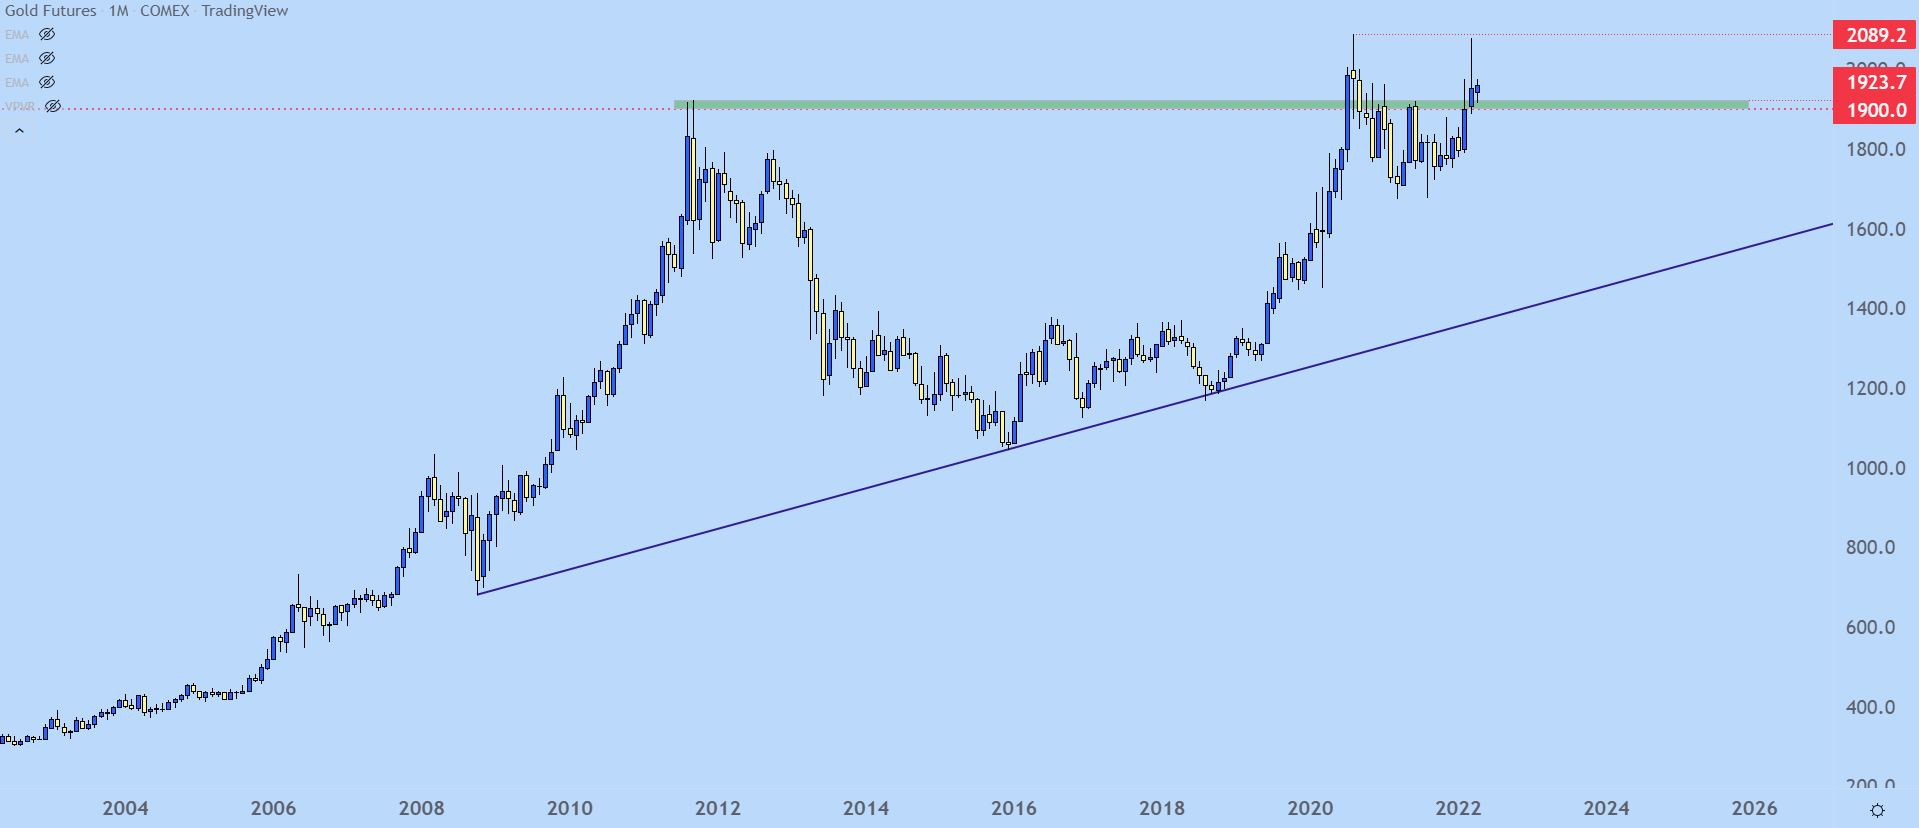
Chart prepared by James Stanley; Gold on Tradingview
Gold Shorter-Term
There was even an episode where it looked like Gold bears might get their way, after a bear flag had built on shorter-term charts and sellers were even able to evoke a push below the 1900 psychological level.
But prices quickly snapped back as the range returned and Gold prices just continued to meander within that range until testing a quick breakout to start this week.
Gold Four-Hour Price Chart
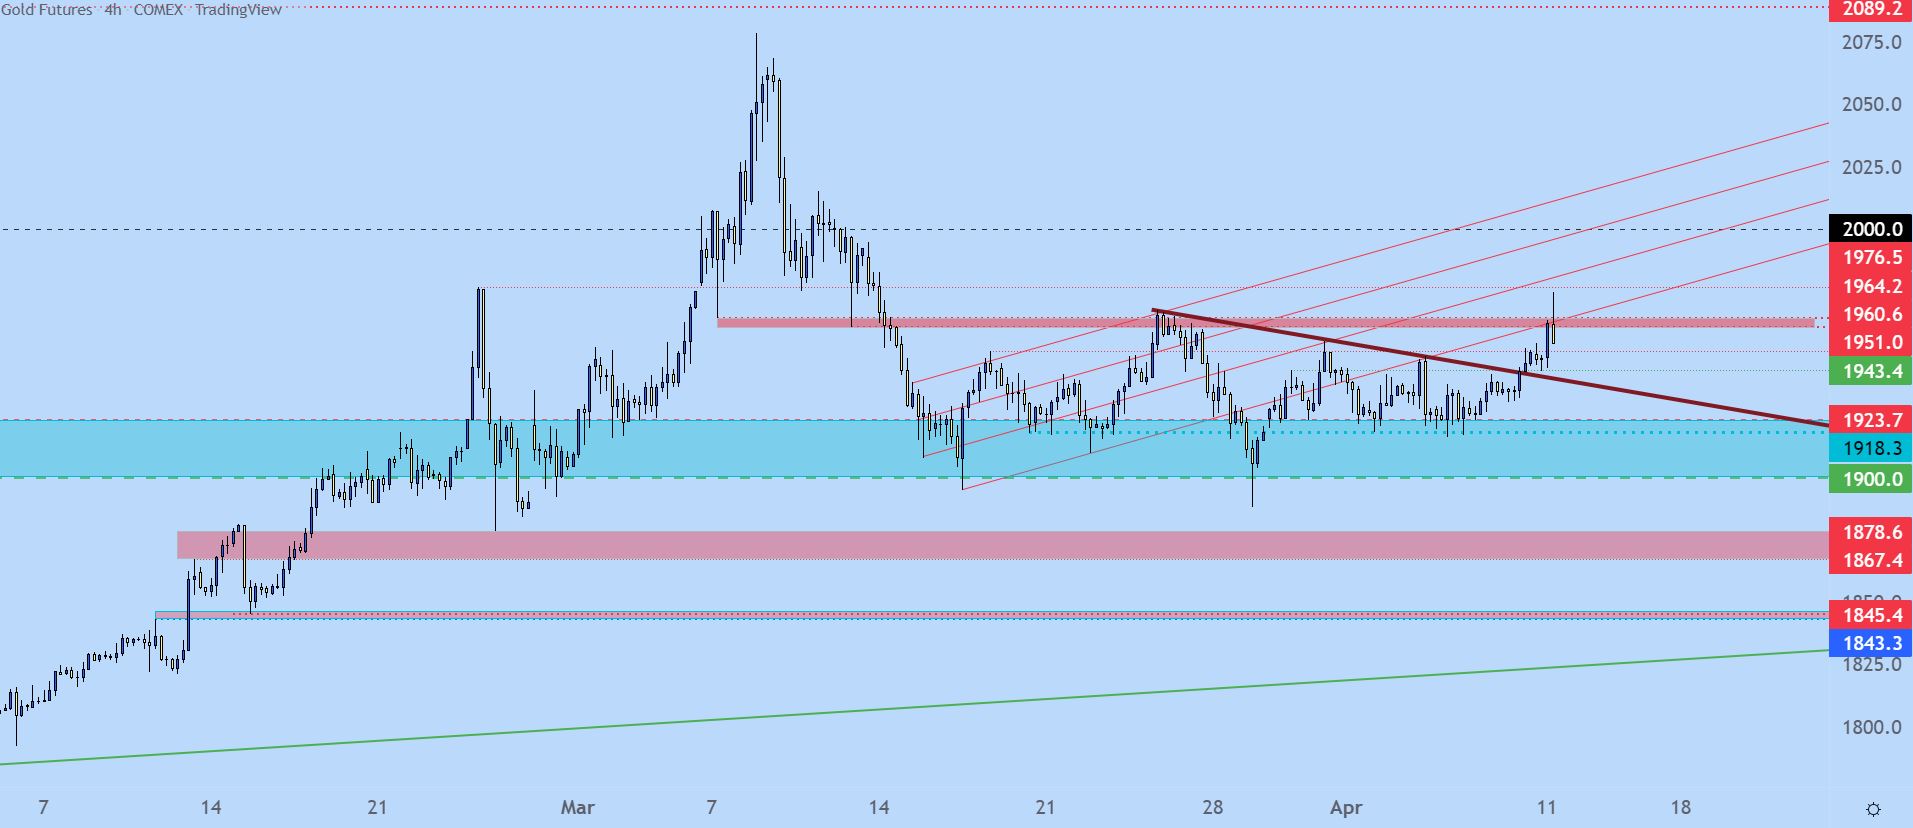
Chart prepared by James Stanley; Gold on Tradingview
Gold Moving Forward
I continue to harbor bearish expectations for Gold but the fact of the matter is that sellers had ample opportunity to take advantage of the situation and so far haven’t. This often means that something else is going on and taken from price action, that appears to be the case.
At this point, Gold carries short-term bullish potential and this is something that could bring that key level at 1976 back into the equation. And if that’s traded at this week, the door is open for another retest of the $2,000 psychological level.
From the hourly chart below, a couple of key levels stand out: The price of 1951 remains as support potential, as taken from prior short-term resistance. Below that is secondary support at 1943.40.
On the resistance side of the matter, the zone from 1960-1964 still looms large but beyond that, it’s the same 1976 level that was in-play after the February 24th spike that comes back into the equation.
Gold Hourly Price Chart

Chart prepared by James Stanley; Gold on Tradingview
--- Written by James Stanley, Senior Strategist for DailyFX.com
Contact and follow James on Twitter: @JStanleyFX


