


US Dollar Talking Points:
- Tomorrow morning brings the release of CPI data for the month of January.
- Expectations are high with markets looking for a 7.3% headline print to go along with 5.9% Core CPI print.
- The US Dollar is holding near two-week-lows ahead of the CPI release: Below I look at which pairs might be most attractive for scenarios of USD strength and weakness.
- The analysis contained in article relies on price action and chart formations. To learn more about price action or chart patterns, check out our DailyFX Education section.
Trade Smarter - Sign up for the DailyFX Newsletter
Receive timely and compelling market commentary from the DailyFX team
The US Dollar has very much been in focus so far this year as the world begins to lay the groundwork for greater recovery. With Central Banks starting to look at possible rate hikes and, in some cases, even starting to hike rates, a number of major currencies have remained on the move.
In the US Dollar, considerable strength was priced-in last year as inflation continued to grow even as the Fed discounted it as ‘transitory.’ And while the Fed’s own forecasts turned out to be very incorrect, to the point that many are expecting the bank to play catch-up with rate hikes this year, this fails to acknowledge the fact that those expectations are still resting on a set of forecasts that’s continually turned out to be incorrect. This adds a bit of opacity to the backdrop, particularly after two or three hikes in the U.S..
Elsewhere, however, that preparation for higher rates has continued to take-hold. The recent story on this topic comes from Europe, where last week saw the ECB start to slowly open the door to tighter policy options at some point later this year. That led to a strong move in EUR/USD as the pair pushed up to a key zone of resistance.
In the USD, prices are holding very near the two week low. Last week started with confirmation of an evening star formation which then led to three days of large losses. A bit of support stared to play-in last Friday and bulls have had ample opportunity to push this higher but, as yet have failed to do so. This can keep a bearish bias in the matter and there’s even short-term resistance potential around a spot of prior support, taken from around the 95.86 Fibonacci level.
US Dollar Daily Price Chart
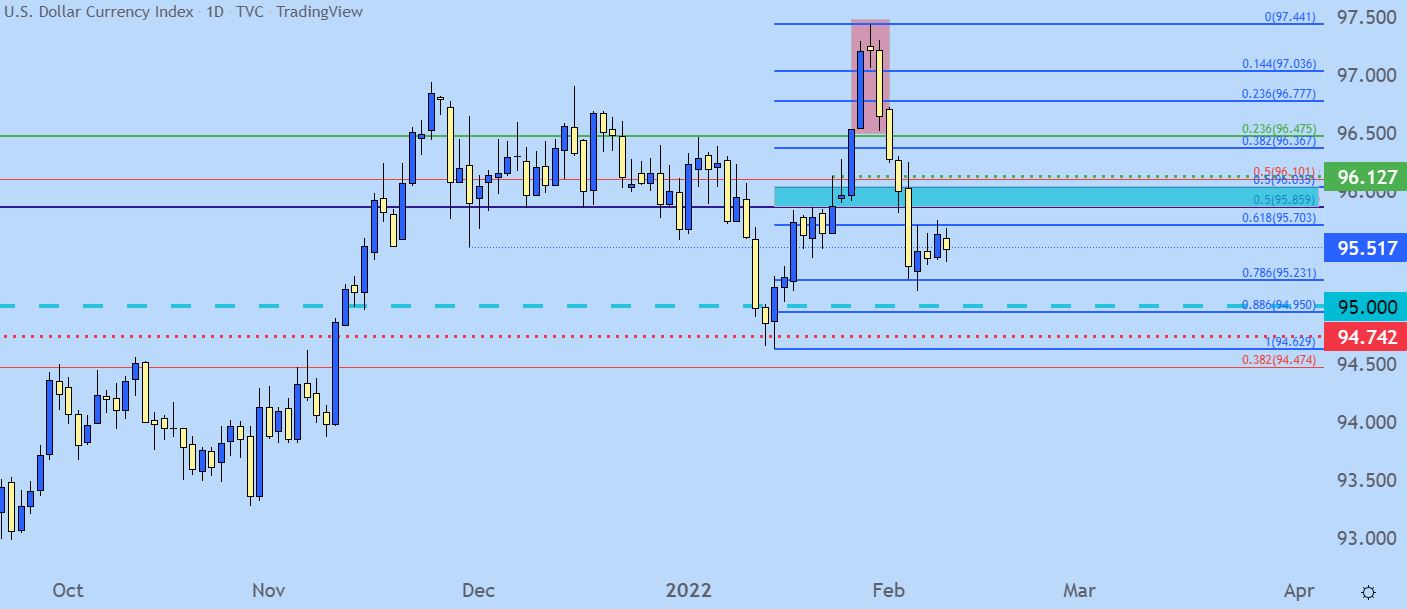
Chart prepared by James Stanley; USD, DXY on Tradingview
USD Shorter-Term
On a shorter-term basis, that support bounce that started last week took on the form of a correction. The bounce built in as a rising wedge formation, which is often approached with the aim of bearish reversals.
This rising wedge also takes on the appearance of a bear flag formation, which is similarly plotted for bearish scenarios. This can help to retain a bearish bias on the USD near-term, with a sustained break (daily close) above resistance acting as some form of negation of the short-term bearish theme.

US Dollar Two-Hour Price Chart
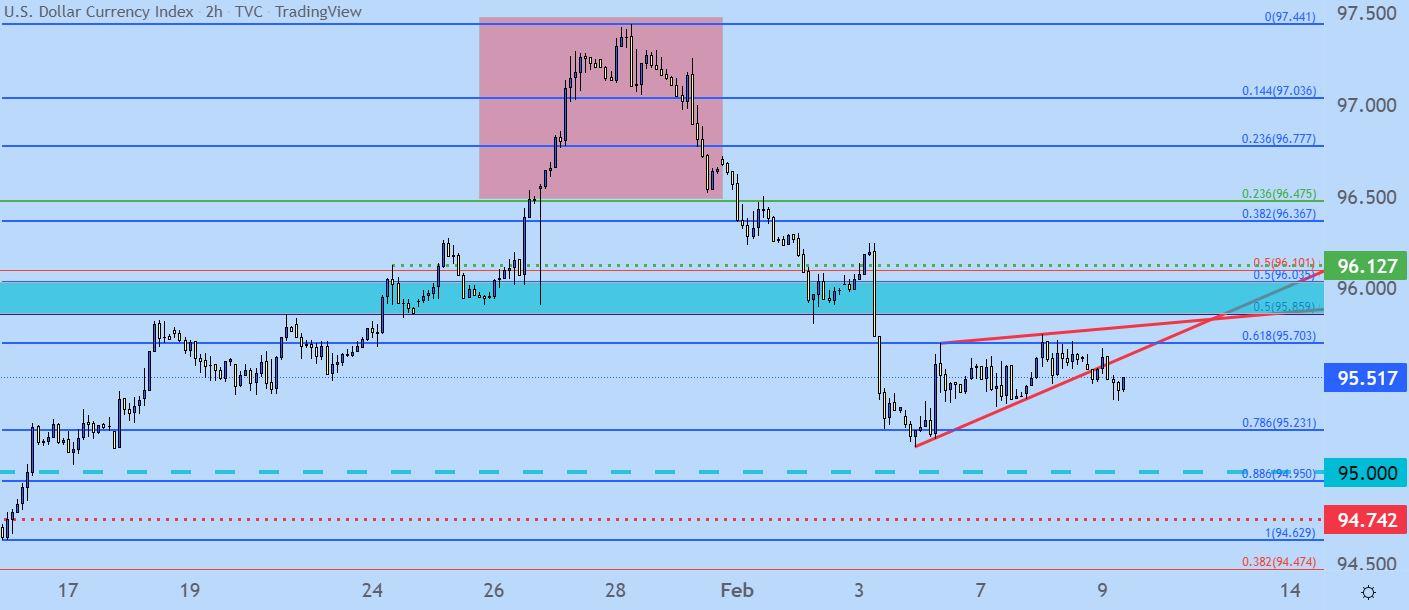
Chart prepared by James Stanley; USD, DXY on Tradingview
EUR/USD
I had looked into bullish breakout potential behind EUR/USD on Monday of this week. As of this writing, that scenario remains alive and this presents a mirror image scenario to the USD above.
As looked at ahead of the resistance test, the 1448-1500 zone is a major inflection point on the chart, and the corresponding breakout after the ECB rate decision saw prices run right to the prior monthly high of 1.1483.
That’s led to a mild pullback but, again like USD, that pullback has so far been rather orderly while taking on the form of a bull flag that’s also a falling wedge, both of which point to bullish potential.
This can help to make EUR/USD as one of the more attractive bearish USD candidates ahead of tomorrow’s CPI, largely based on recent evidence in how the pair reacted to last week’s punch of USD-weakness.

EUR/USD Four-Hour Price Chart
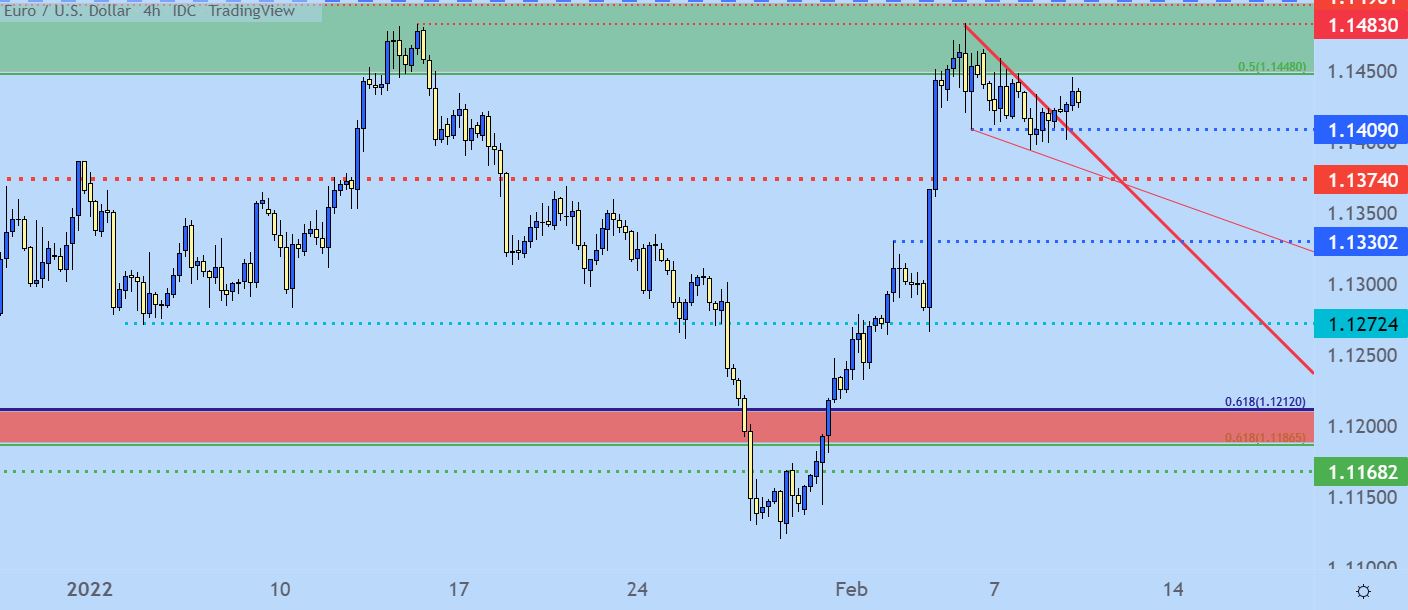
Chart prepared by James Stanley; EURUSD on Tradingview
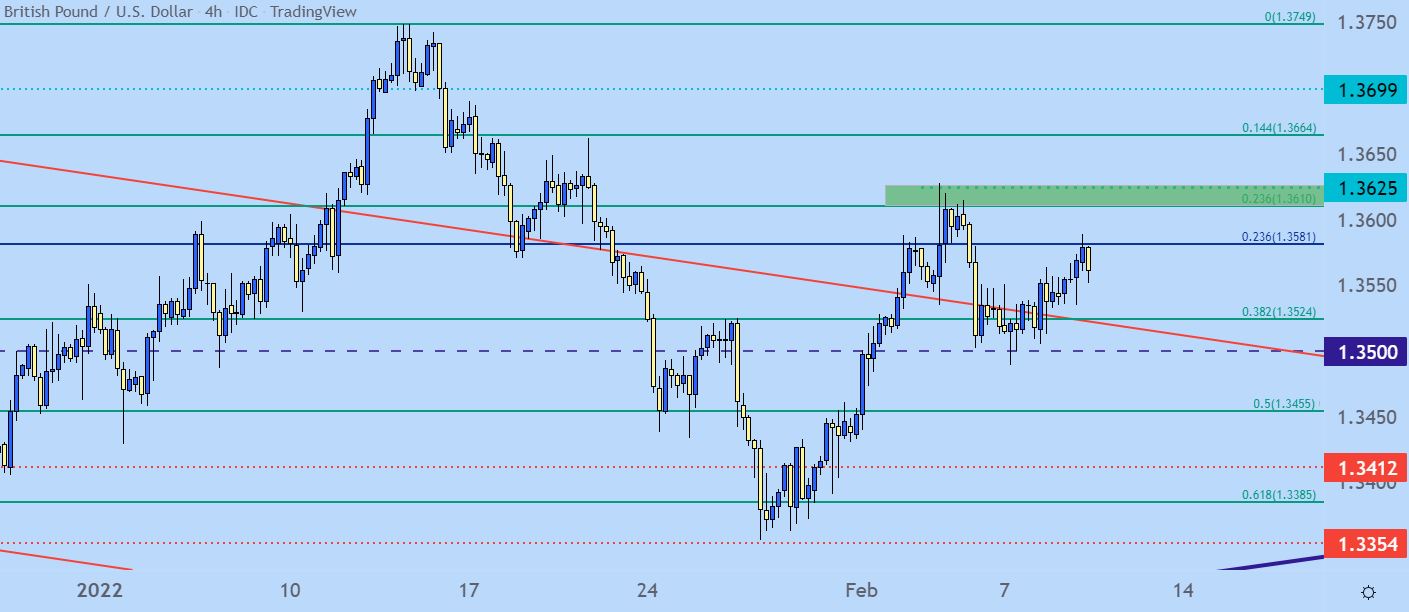
GBP/USD Upside Slacking
I had looked into this one yesterday, highlighting the meager response in GBP/USD even with the US Dollar deluge from last week. This all took place even as the Bank of England hiked rates, highlighting a similar situation for the USD and the Fed, at the moment.
Sure, expectations are really high for the Fed to hike rates a lot of times this year, similar to the BoE. But, that’s already known and has been for some time: It’s already factored into price. So, the simple act of the BoE or the Fed being slightly less-hawkish than expected can bring a reversal of fortunes.
If we do end up with USD strength on the back of tomorrow’s CPI report, I like the premise of looking to take advantage of that relative lack of enthusiasm on the long side of Cable. As highlighted yesterday, there’s a bit resistance zone around the 1.3625 level with another around the 1.3700 handle, each of which can provide some element of invalidation for bearish themes. Underside price action highlights the 1.3500 psychological level, and a breach of that can open the door for a push down towards 3455 followed by 3385.

GBP/USD Four-Hour Price Chart
USD/JPY Stage is Set
USD/JPY is a pair that can cut either way at this point. From the bigger picture, price action in the pair spent much of last year brewing in a rising wedge pattern, often approached with the aim of bearish breakdowns.
That theme started to show in early-2022 trade, but sellers were twice thwarted at the 113.50 level, after which bulls made another move on resistance around the 115/115.60 level.
USD/JPY Daily Price Chart
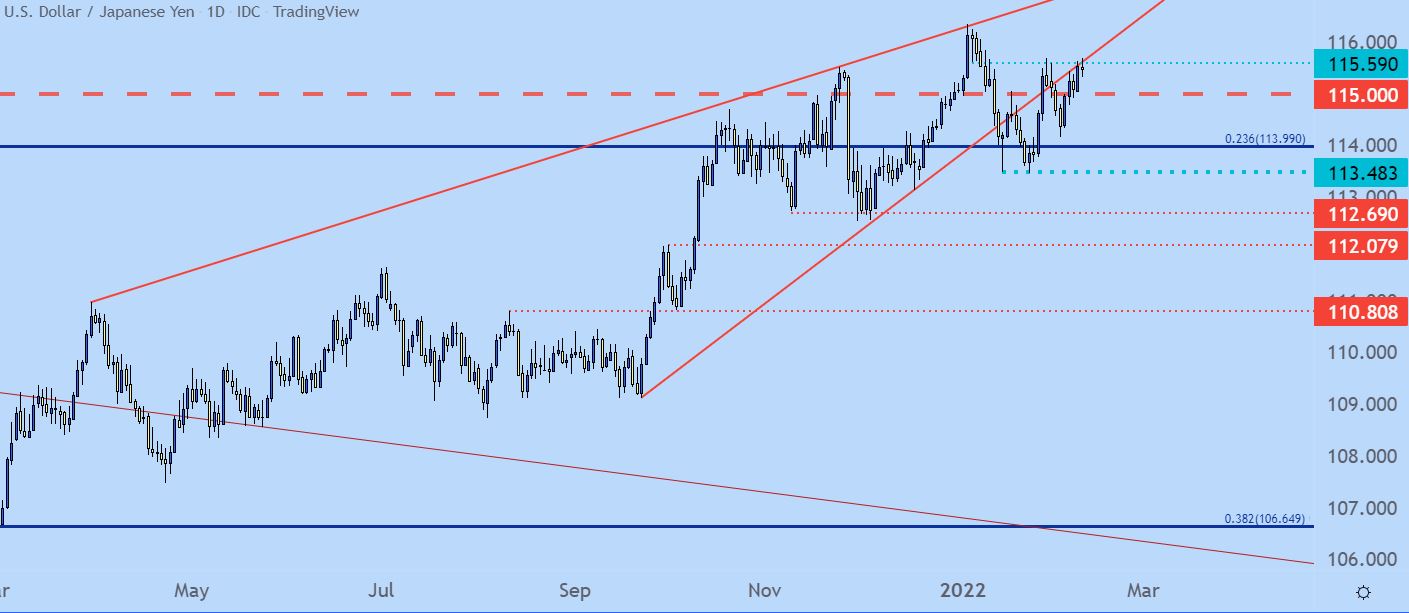
That resistance has since held and from a shorter-term point of view, this presents an ascending triangle formation – a bullish formation often approached with the aim of topside breakouts.
But the longer-term bearish formation still remains and a hold of resistance in this region keeps the door open for a longer-term bearish shift in the pair. This one will very much remain in focus over the next couple of days, particularly for queues on directional USD biases.

USD/JPY Four-Hour Price Chart
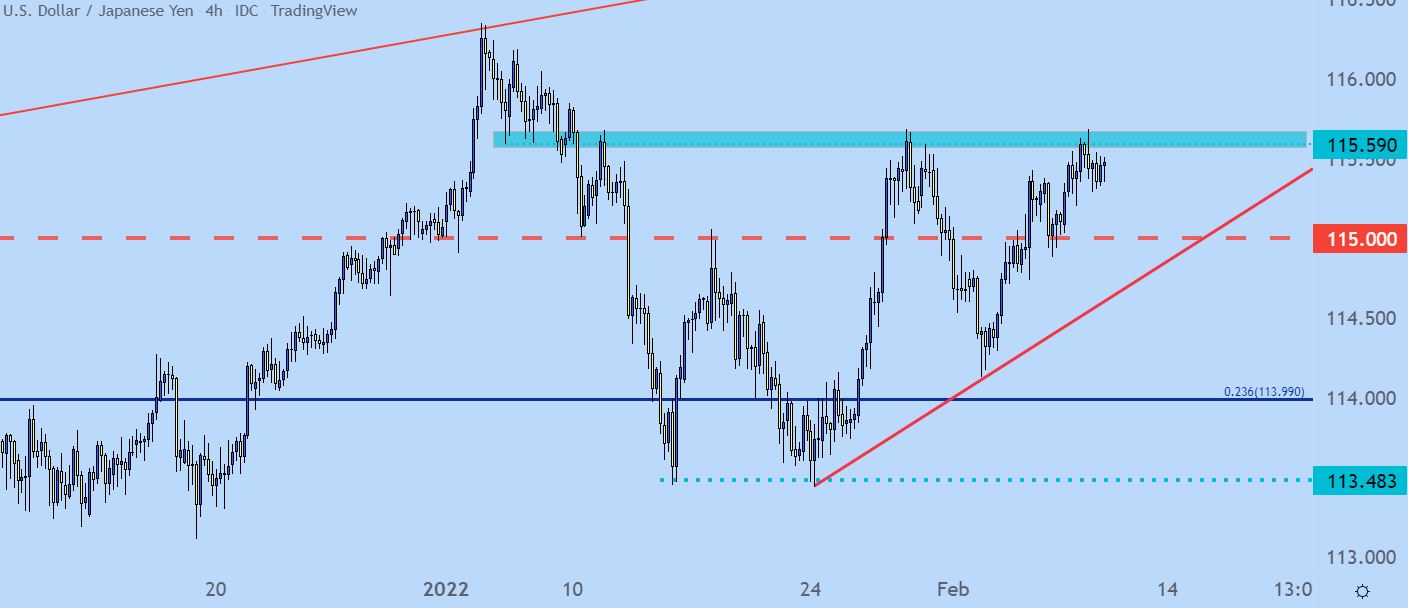
Chart prepared by James Stanley; USDJPY on Tradingview
--- Written by James Stanley, Senior Strategist for DailyFX.com
Contact and follow James on Twitter: @JStanleyFX


