


FOMC, USD, US Dollar, EUR/USD, GBP/USD, USD/JPY Talking Points:
- Tomorrow brings the September FOMC rate decision.
- The big question is whether the Fed announces taper tomorrow or whether they punt that announcement to the November rate decision, waiting for employment data to improve to the point of ‘significant further progress.’
- The analysis contained in article relies on price action and chart formations. To learn more about price action or chart patterns, check out our DailyFX Education section.

The September FOMC rate decision is finally approaching, and we’ve been waiting on this one for a couple of months now after the Fed started talking up the prospect of taper at the July rate decision. The meeting minutes from the July FOMC showed that most members felt it would be appropriate to start whittling down bond purchases by the end of the year. And deductively, that put a beacon on September as an important date.
In August, we heard from Jerome Powell at Jackson Hole where the head of the FOMC indicated that he US economy had met the bar for ‘significant further progress’ in terms of inflation. But, for employment, the economy was still lacking and the bank wanted to read more information before making a move. The September NFP report was abysmal, however, and more recently, we’ve seen another risk arise with the financial troubles at Evergrande in China.
To learn more about the FOMC, check out DailyFX Education
Will this compel the Fed to punt? Technically, they could make a taper announcement in November, set to begin in December. But regardless, tomorrow will bring updated guidance and projections from the bank, and this information may be enough to feed market prognostications around a potential November announcement for tapering asset purchases.
In the US Dollar, strength has been the recent name of the game as the Greenback caught a bid two weeks ago that has yet to dissipate. That strength was on full display last week and that held through this week’s open, with DXY rushing up for a test of the 93.43 level that was looked at on Friday. That level currently helps to mark the September high for the currency.
US Dollar Four-Hour Price Chart
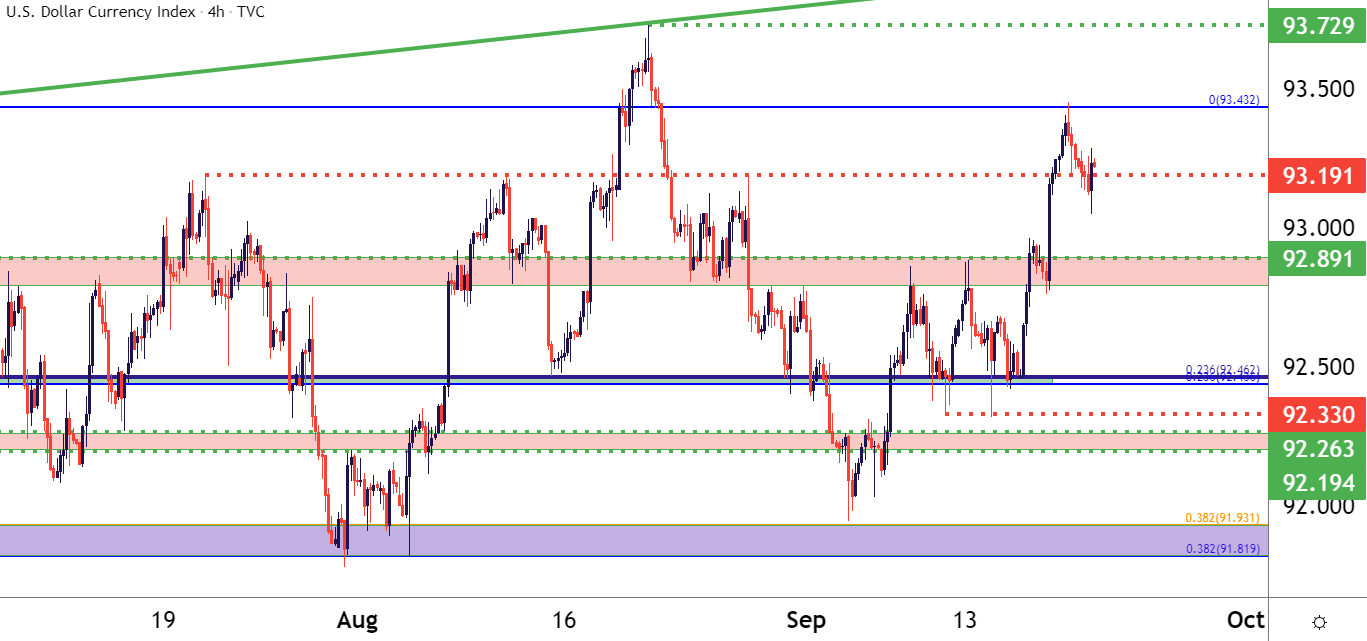
Chart prepared by James Stanley; USD, DXY on Tradingview
Taking a step back to the longer-term, and so far this year the US Dollar has been mean reverting; accented with a recent threat to go into a bullish long-term trend. Key will be driving through this current batch of resistance sitting overhead from the 93.43 level that was in play this week up to the 93.73 level that currently marks the 2021 high in the currency.
US Dollar Weekly Price Chart
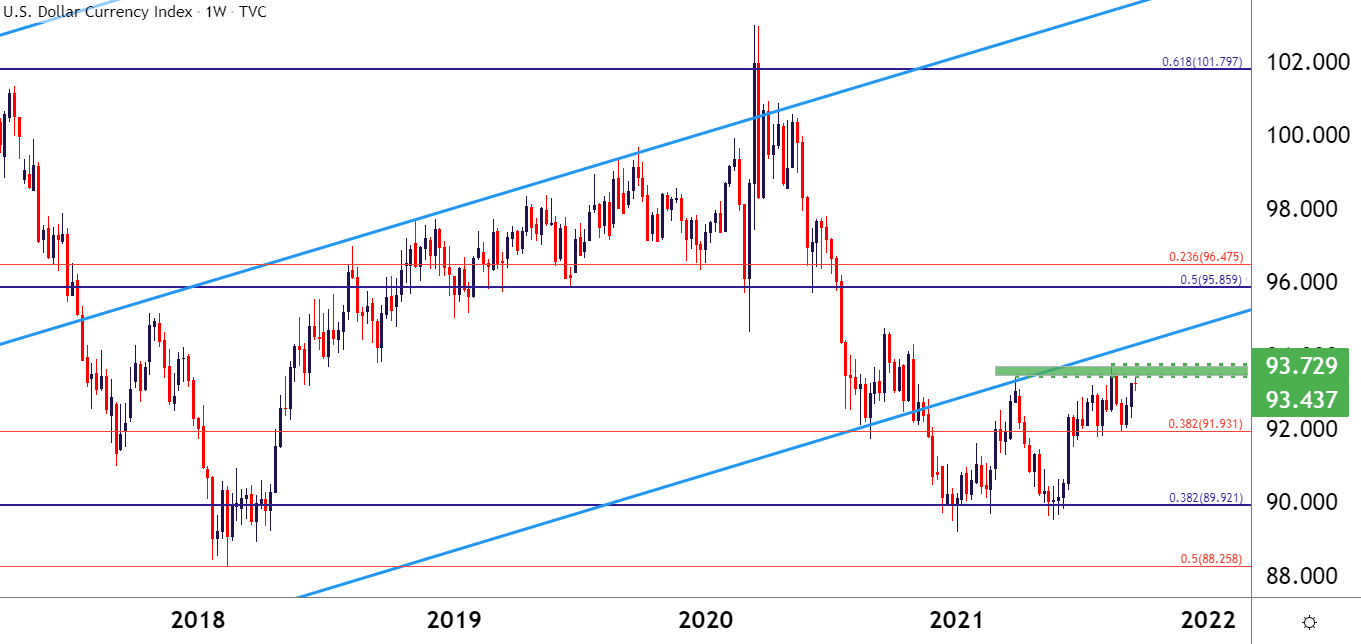
Chart prepared by James Stanley; USD, DXY on Tradingview
EUR/USD Tests Big Support
Earlier in the month EUR/USD had pushed up for another test of resistance in the 1.1900 area on the chart. After a hold there, prices began to fall and already price action is re-engaging with a big zone of support in the pair, bound between two Fibonacci levels at 1.1709 and 1.1736.
To learn more about Fibonacci, check out DailyFX Education
This zone had come into play earlier in the year to help mark the Q1 low. That led to a vigorous bounce but, in August, this zone was back in play. That second test actually allowed for the zone to breach a bit, with a fresh 2021 low being set at 1.1664.
This can keep the door open for breakdown potential in the pair. The next spot of support on my chart is around 1.1603, taken from election low in November of last year.
EUR/USD Daily Price Chart
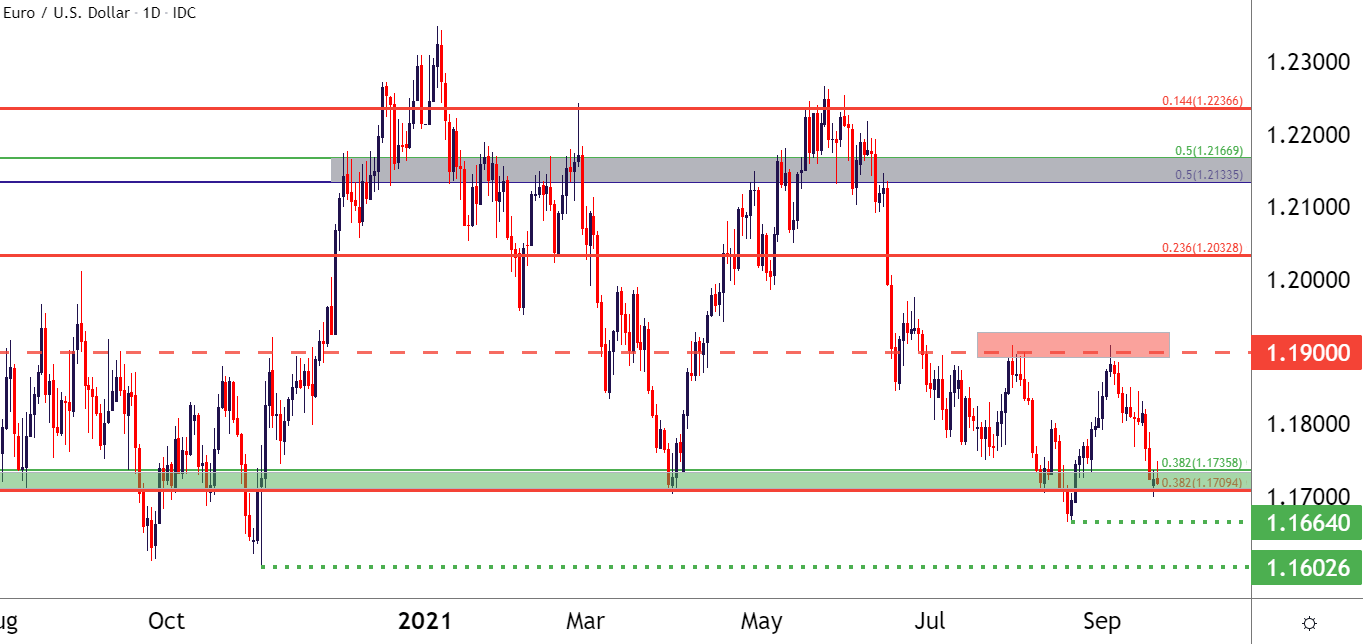
Chart prepared by James Stanley; EURUSD on Tradingview
GBP/USD Bearish Potential
While EUR/USD was able to push up for a test of that swing-high at 1.1900 earlier in September, GBP/USD put in a lower-high and price action has been similarly bearish ever since. Like EUR/USD, there’s some support in play currently helping to hold the lows but, unlike the above setup this support is much more short-term in nature. The seven month low is at 1.3574 and a break of that level opens the door for a run down towards the 1.3500 psychological level or perhaps even the 1.3464 Fibonacci level that was last in play on January 11th.
GBP/USD Daily Price Chart
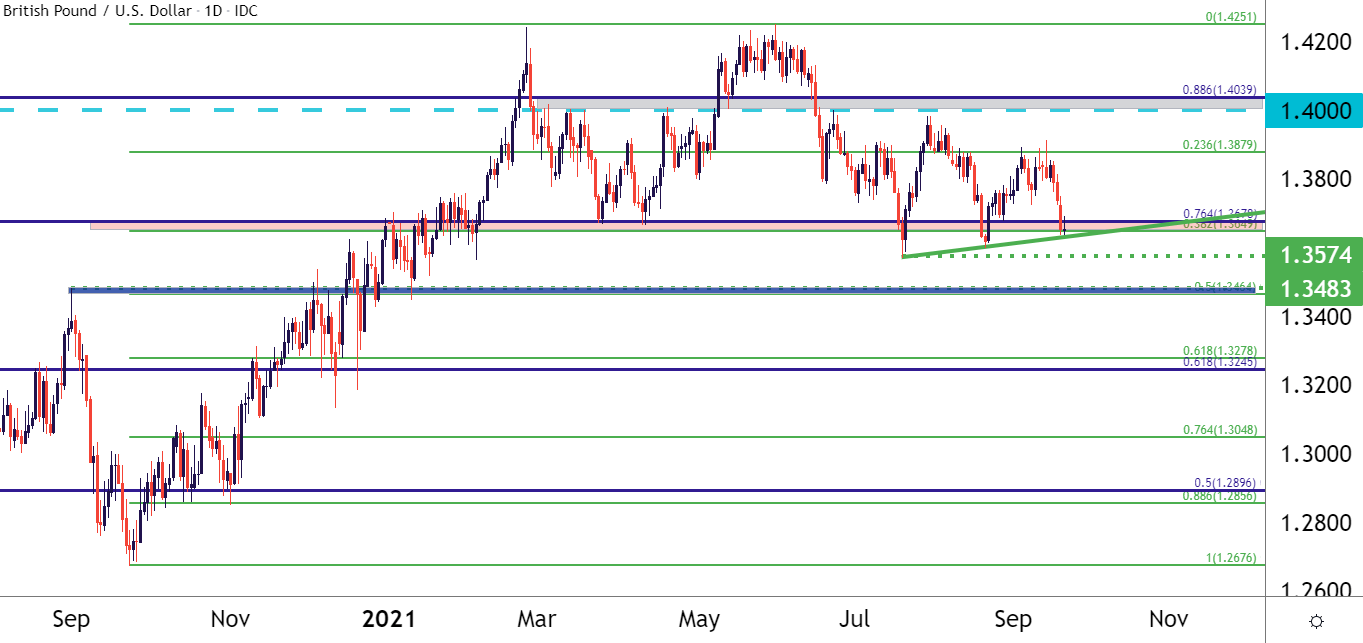
Chart prepared by James Stanley; GBPUSD on Tradingview
USD/JPY A Long-Term Matter
While many USD pairs have been trending hard in either direction, USD/JPY has been digesting over the past couple of months and that could lead to an eventual break, at some point. The matter of interest for tomorrow is whether USD bulls are able to defend support at the 109.00 area through tomorrow’s rate decision.
USD/JPY has taken on a relationship with US rates this year, with a strong pop in Q1 as US rates were increasing. Price action in USD/JPY eventually ran into Fibonacci resistance at 111.61, which is currently helping to set the 2021 high in the pair.
USD/JPY Daily Price Chart
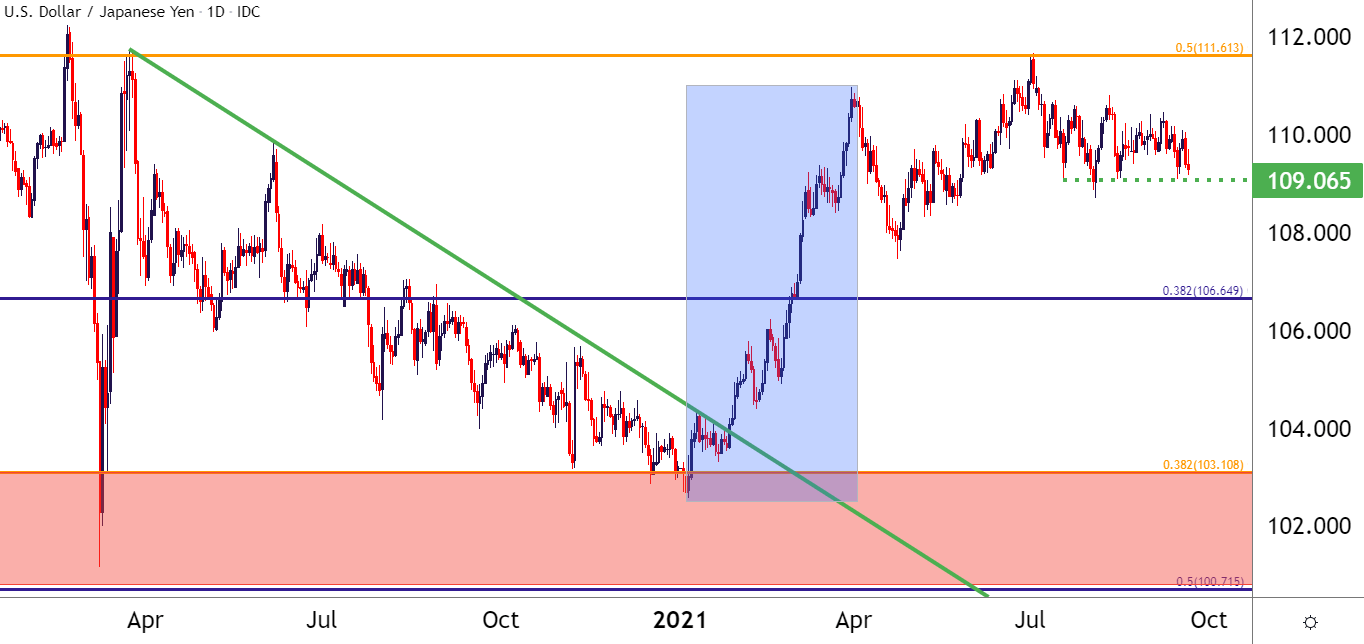
Chart prepared by James Stanley; USDJPY on Tradingview
Taking a step back on the chart highlights the importance of the current zone of resistance. This same Fibonacci level, spanned up to the 112.50 psychological level, has helped to mark the yearly high in USD/JPY in 2019, 2020 and now 2021.
This is a very important zone and a breach above 112.50 gives us three-year-highs in USD/JPY.
USD/JPY Weekly Price Chart
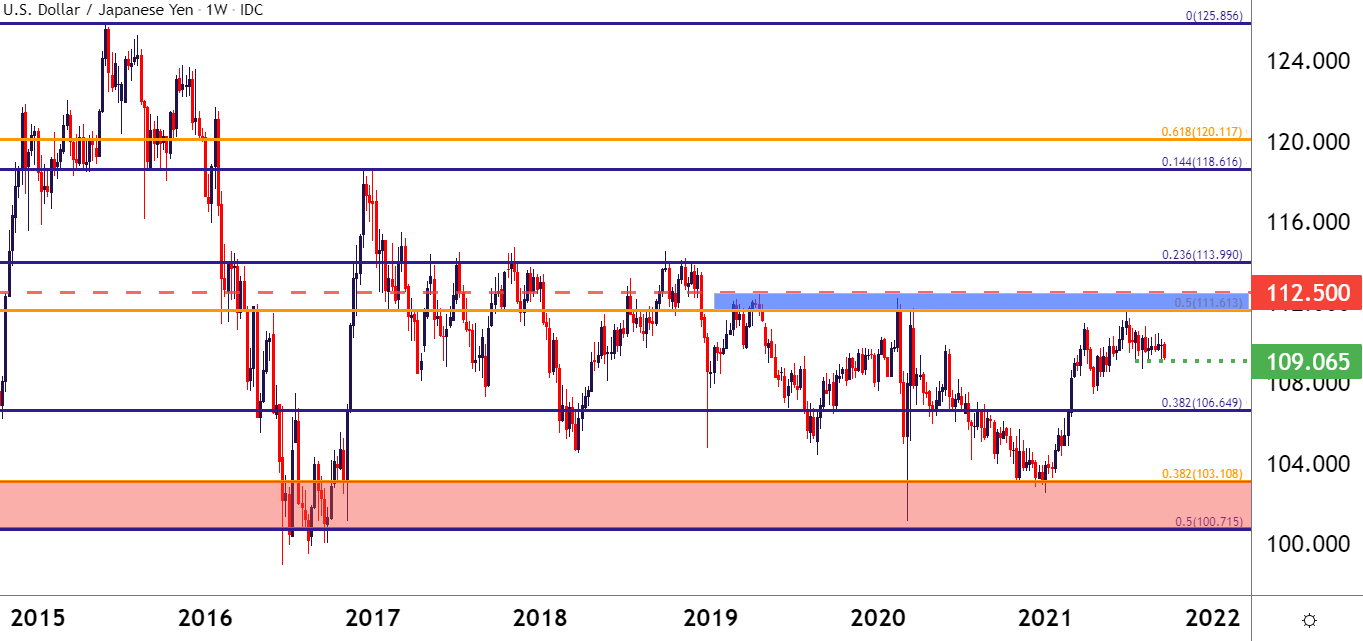
Chart prepared by James Stanley; USDJPY on Tradingview
--- Written by James Stanley, Senior Strategist for DailyFX.com
Contact and follow James on Twitter: @JStanleyFX


