


Gold Talking Points:
- Gold just closed June as its worst month since November of 2016.
- Already in July Gold prices have put in a stern bounce – but does this change the big picture?
- The next major drivers in the rates theme are expected later this summer, keeping the door open to mean reversion and retracement themes in the yellow metal.
It was a rough month of June for Gold bulls. The yellow metal put in its worst month since November of 2016, and as highlighted last week, that month of underperformance came in ahead of eight rate hikes over the next two years, from December 2016 through December of 2018.
And given the current backdrop and the driver that pushed Gold over the ledge last month, the similarity makes sense, as the recent bearish push in Gold was driven by the signaling in the FOMC projection that highlighted two possible rate hikes in 2023.
But, as also shared in that recent article, Gold prices were in the process of testing a key support level, taken from the neckline of a double bottom formation; and that kept the door open for reversal themes on a short-term basis. The rally from that support has continued to hold through the weekly open, constituting a jump of more than $65 at one point.

Gold Hourly Price Chart

Chart prepared by James Stanley; Gold on Tradingview

Gold Holiday Rally: Does it Change Anything?
Not really. As looked at ahead of the NFP release and the long weekend around the Fourth of July, the next major drivers on the rates theme that’s seemed to really impact Gold is later this summer. The Jackson Hole Economic Symposium takes place in August and the September FOMC rate decision is the next big item. And on top of that, nothing substantial has come out on the wires around the rates theme and there doesn’t appear to be much that has changed.
With that said, it’d be unlikely that the motive that drove this bearish trend throughout the month of June would suddenly just go away. So, while there is a short-term bullish theme with fresh higher-highs and higher-lows, this may be setting up into the lower-high of a longer-term theme in which bears continue to position for an eventual change in FOMC focus.
For traders with a longer-time frame, waiting to see how prices react at these points of possible lower-high resistance can be key for bearish approaches. Going out to the four-hour chart presents a couple of these areas, with a Fibonacci level around 1825 as the most nearby; and there’s a secondary area of prior support resting around the 1850 level that could similarly be utilized for lower-high resistance in bearish approaches.
On the support side, the area around 1795-1800 appears interesting, and for those short-term bullish approaches a hold of support here keeps the door open for a test of 1825 or, perhaps even 1850.
Gold Four-Hour Price Chart
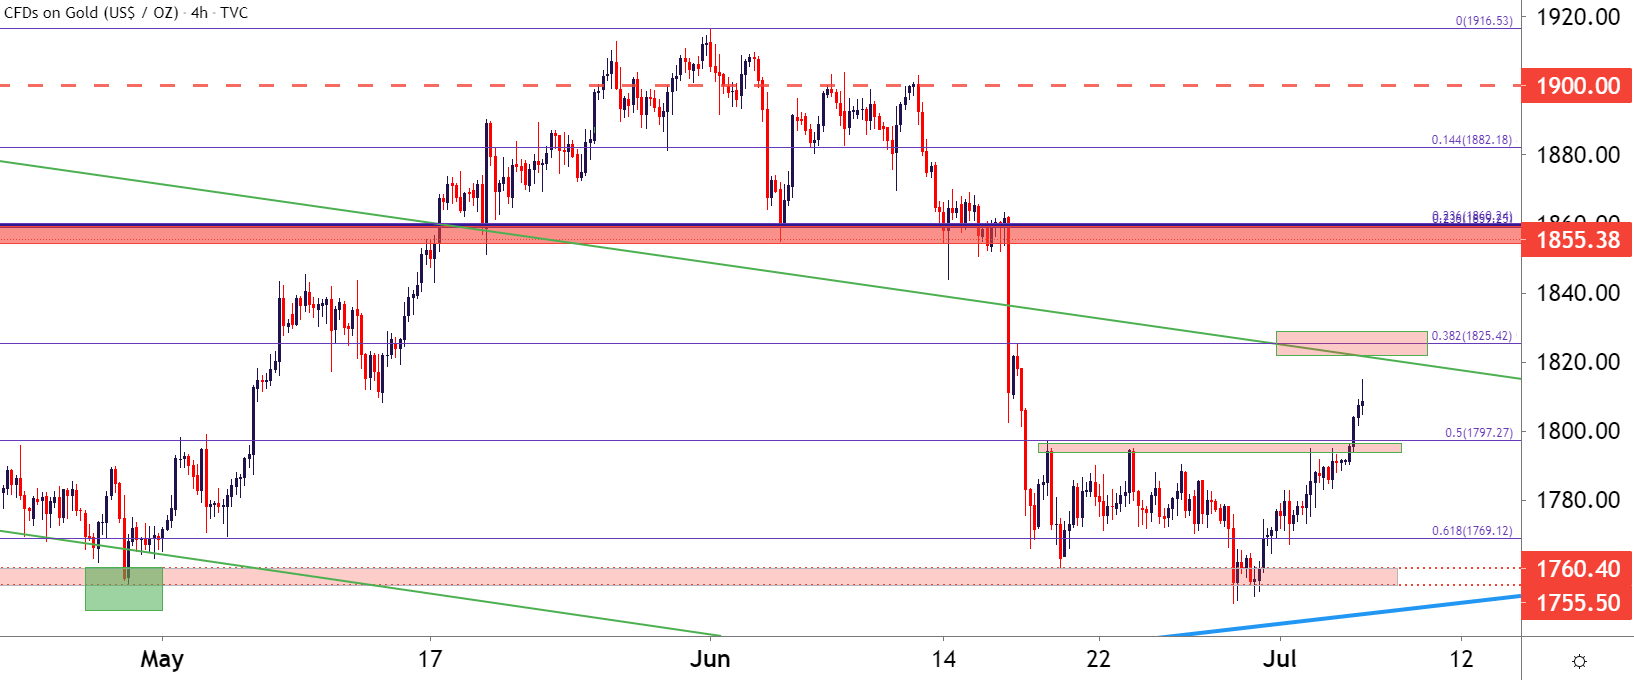
Chart prepared by James Stanley; Gold on Tradingview

Gold Prices: Bigger Picture
Taking a further step back on Gold and we can see where the month of June took out more than 61.8% of the rally that took all of April and May to build. The trendline projection from the longer-term bull flag plots very near that 1825 level that’s also the 38.2% retracement of the April-May bullish move. This could turn out to be a key test if it happens, as this would see the short-term bullish trend colliding with the longer-term bearish trend at a very key inflection point on the chart.
Gold Daily Price Chart

Chart prepared by James Stanley; Gold on Tradingview
--- Written by James Stanley, Senior Strategist for DailyFX.com
Contact and follow James on Twitter: @JStanleyFX


