


Copper, Silver Talking Points:
- It’s been a rude start to Q4 for Copper prices.
- Silver prices have struggled to set support over the past week, but today’s move is encouraging for Silver bulls and there may be scope for topside continuation.
- The analysis contained in article relies on price action and chart formations. To learn more about price action or chart patterns, check out our DailyFX Education section.
Today marks the beginning of Q4 and already a number of interesting moves have priced-in. Stocks are showing signs of stability as hopes for a stimulus deal remain; but it’s the commodities space that’s arguably more interesting as there’ve been some interest moves there, as well. Copper is putting in an aggressive sell-off after closing September and Q3 trade in a somewhat upbeat fashion. As my colleague Daniel Moss pointed out, there was even scope for a run at the 2020 highs as the page turned into October, helped along by some positive data out of China; but after a troubling morning of price action Copper finds itself trading at fresh two-month-lows and below a couple of areas of key chart support.
Copper Daily Price Chart: Copper Bear Pounce at the Q4 Open
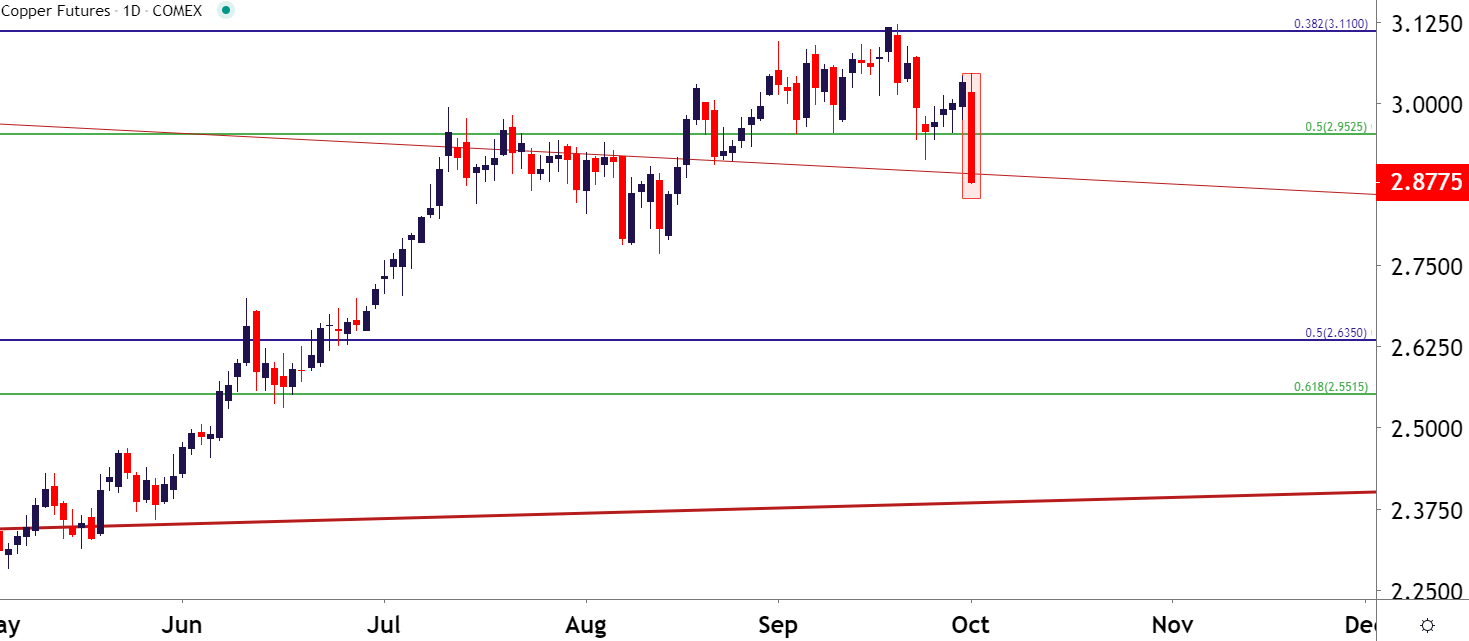
Chart prepared by James Stanley; Copper on Tradingview
That prior support level was a key price in Copper, and the 2020 high comes in at another interesting level of resistance. The former of those prices is the 50% marker of the post-Financial Collapse major move while the latter is the 38.2% Fibonacci retracement of the 2001-2011 major move. These levels help to provide some near-term structure for Copper, and strategy parameters will be looked at below.
Copper Monthly Price Chart
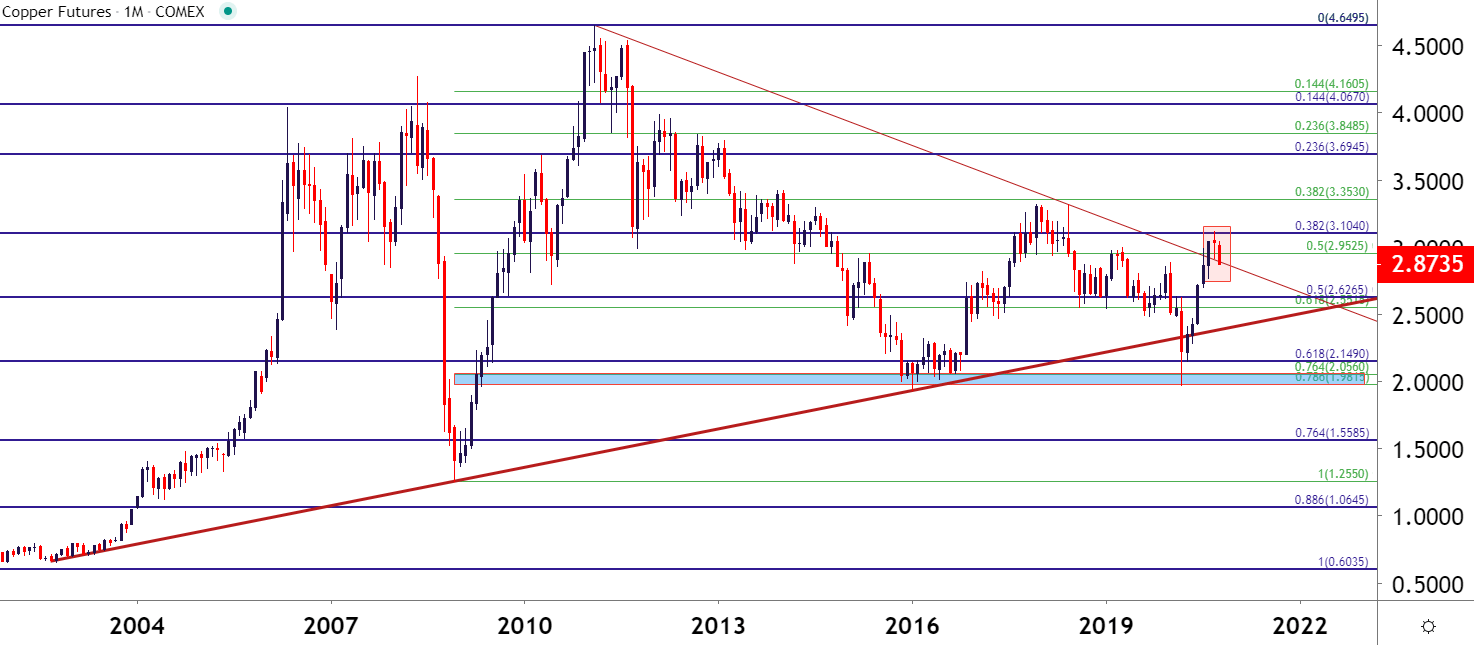
Chart prepared by James Stanley; Copper on Tradingview
On the above chart, take note of the descending trendline that’s been helping to guide resistance since the 2011 top. That trendline has come back in-play with this morning’s sell-off, and price action is currently trading back below this line-in-the-sand.
This highlights a potentially oversold scenario; and for those that are looking to add bearish exposure in this theme, a pullback to resistance at that prior spot of support can re-open the door for such. This price plots around the 2.95 level; and its been in-play on Copper since July.
Copper Four-Hour Price Chart
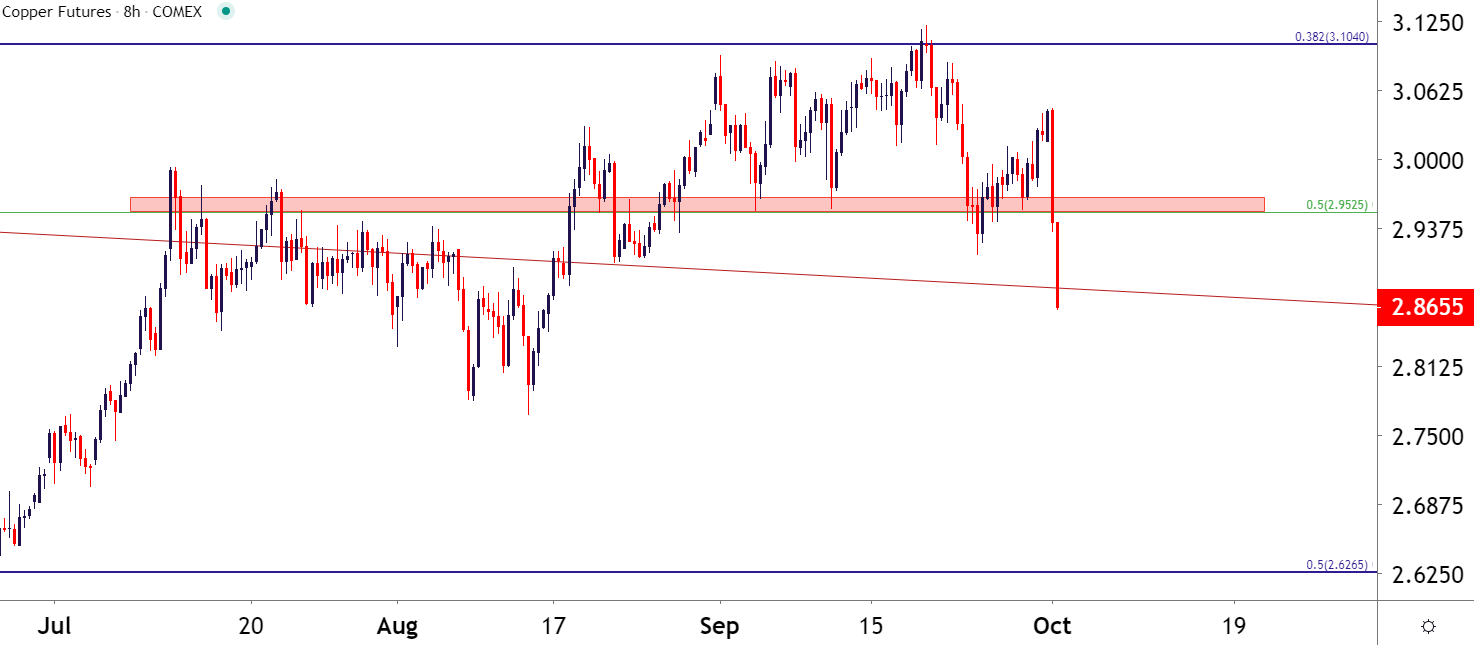
Chart prepared by James Stanley; Copper on Tradingview
Silver Struggles to Set Support
As Copper was getting smashed to start Q4 trade, Silver prices have been trying to set support. But this isn’t necessarily new as Silver prices have been trying to set support for about a week and, it doesn’t appear that we’re yet out of the woods for Silver bulls. On the below chart, that support is in full view as there’s a couple of different mechanisms at play. The first and likely most obvious is the bullish trendline: This can be found by connecting March and July swing lows – the projection of which started to come into play last week around those two-month-lows. The second, in green, is a 38.2% Fibonacci retracement taken from the March-August major move. But, also take notice of the resistance level that’s held the advance for two-going-on-three days.
Silver Daily Price Chart
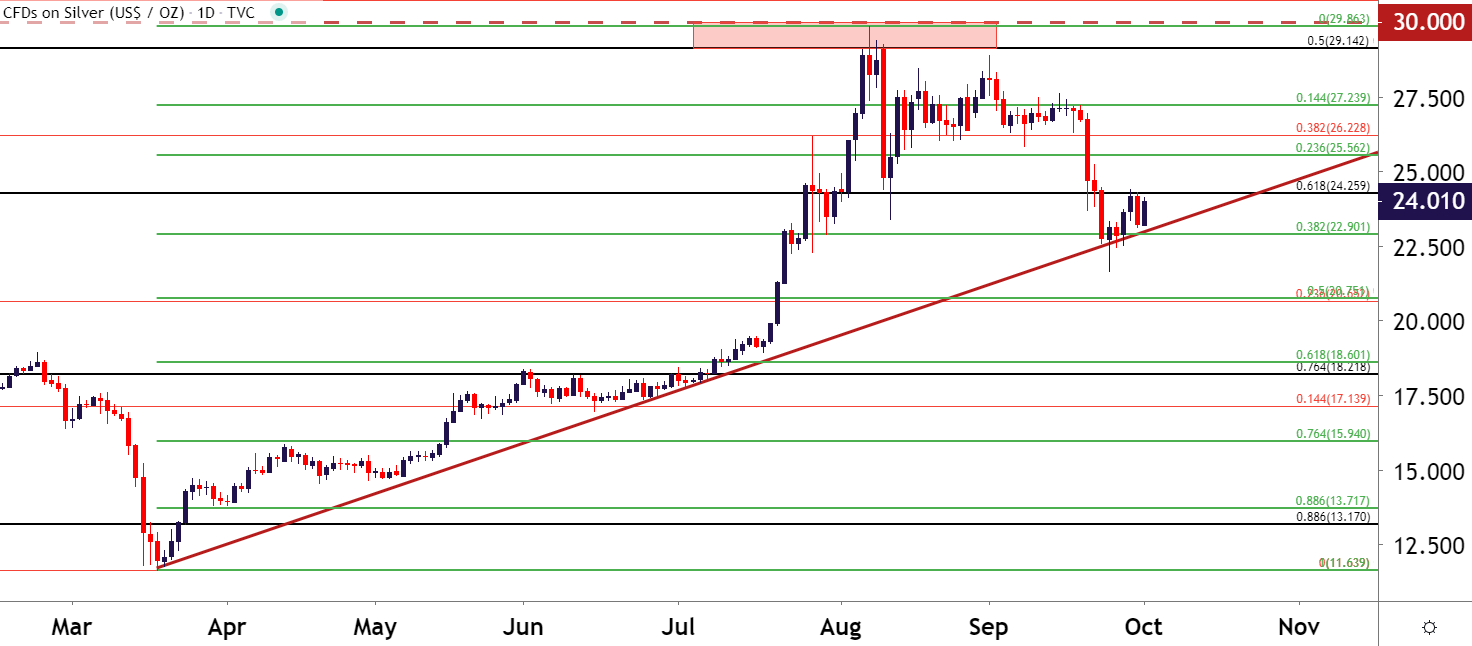
Chart prepared by James Stanley; Silver on Tradingview
Silver Settles Below Key Resistance
The current level of resistance, which has helped to cap the highs over the past few days, comes-in around 24.26, which is the 61.8% retracement of the 2008-2011 major move. This is the same study from which the 50% marker helped to turn around the August bullish advance when Silver prices set fresh seven-year-highs. Breaking above, and re-claiming this level as support will be key for Silver bulls looking for bullish scenarios in the metal.

Silver Monthly Price Chart
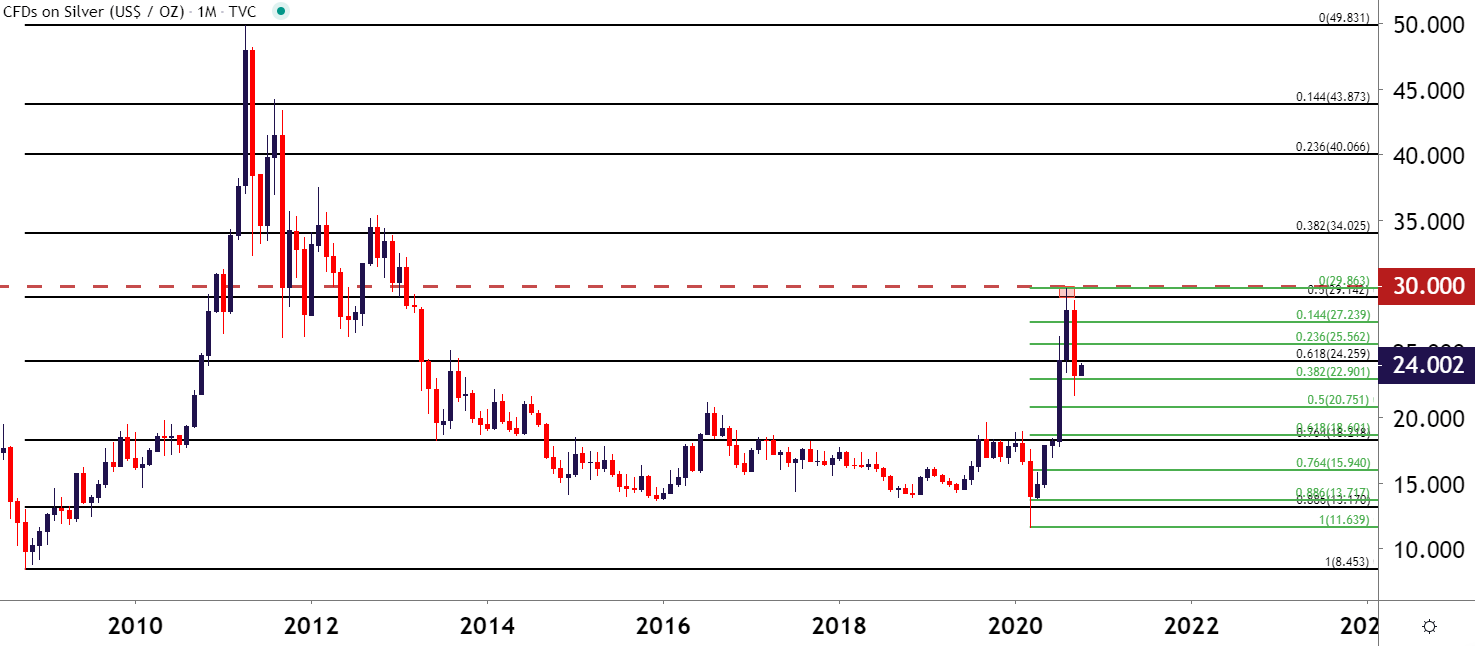
Chart prepared by James Stanley; Silver on Tradingview
On a shorter-term basis, there could be scope for bullish continuation and once again emphasis is placed on the resistance level around 24.26. Price action in Silver has been showing higher-lows for the past week-plus; and this combined with a very obvious level of resistance that’s so far held the highs can keep the door open for bullish breakout potential. And given the longer-term context looked at above, with the possibility of bigger-picture trend continuation looked at in the first Silver chart; and longer-term resistance around the 30-handle (and the 50% marker of the post-Financial Collapse major move), scope could be investigated for bullish trend continuation up to another test of that resistance zone.

Silver Four-Hour Price Chart
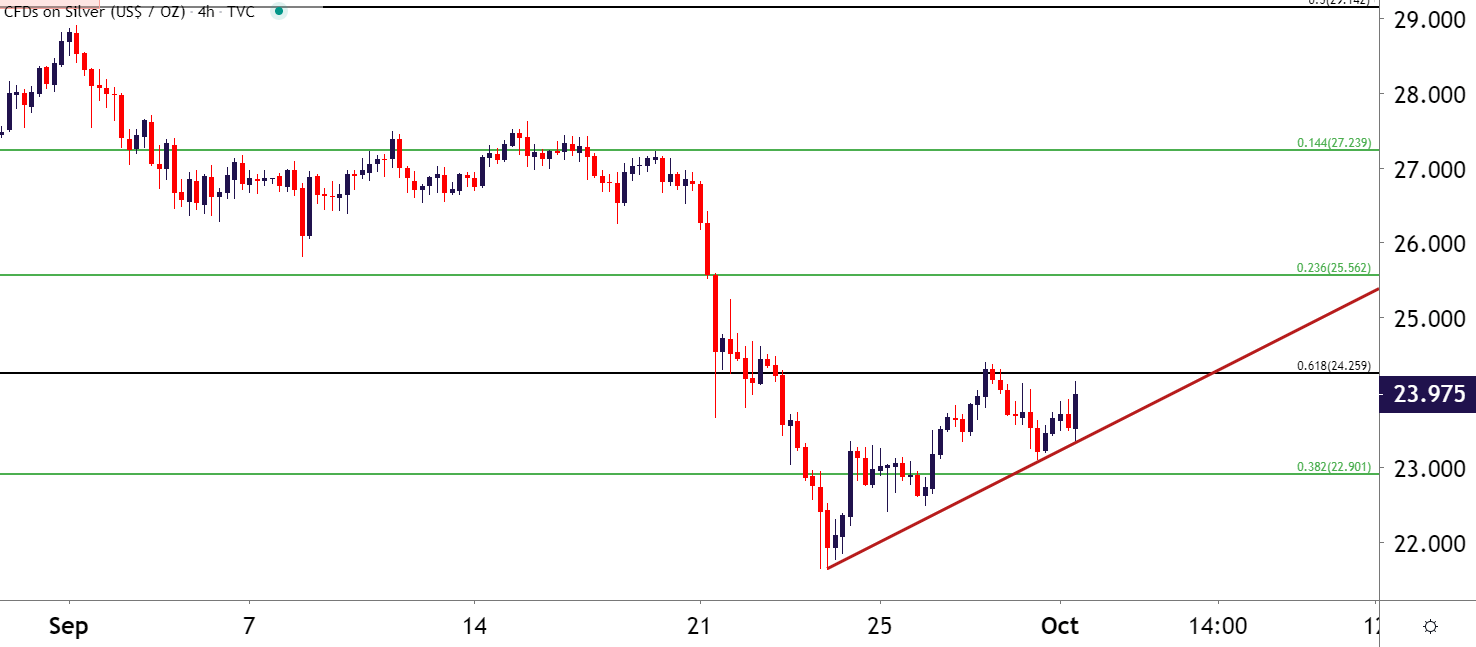
Chart prepared by James Stanley; Silver on Tradingview
--- Written by James Stanley, Strategist for DailyFX.com
Contact and follow James on Twitter: @JStanleyFX


