


Copper Prices, XCU/USD, Fiscal Stimulus, Manufacturing PMI – Talking Points:
- Rebounding global manufacturing activity and significant Chinese demand appears to be underpinning copper prices.
- Long-term trend break suggests that the ductile metal may extend its surge from the March doldrums.
As noted in previous reports, copper’s 56% surge from the March low is showing little signs of abating, after the price of the ductile metal soared to a fresh two-year high last month on the back of rebounding global manufacturing activity and soaring Chinese demand.
However, the reimposition of Covid-19 restrictions in several European nations and the lack of progress in Congressional stimulus talks appears to have capped the potential upside for the global growth proxy in the near-term, with copper prices falling 0.28% in September and ending a streak of five-consecutive months of gains.
That being said, with House Speaker Nancy Pelosi stating that a much-needed fiscal stimulus package could still be delivered before the US Presidential Election in November, and China’s NBS manufacturing PMI expanding for the seventh straight month, the long-term trajectory for copper remains skewed to the topside.
Copper Prices Monthly Chart – Symmetrical Triangle Break May Encourage Buyers

Copper futures (HG) monthly chart created using TradingView
From a technical perspective, copper prices appear to be eyeing a test of the 2017 high (3.3220), after breaking to the topside of a long-term Symmetrical Triangle consolidation pattern and pushing just shy of key resistance at the 38.2% Fibonacci (3.1040).
Although the RSI continues to track the downtrend extending from the 2005 extremes it remains positioned firmly above its neutral midpoint, which hints at swelling bullish momentum and suggests the path of least resistance is higher.
Moreover, with the MACD indicator crossing back into positive territory and price tracking above the 21-, 50-, 100- and 200-day moving averages, a surge towards the psychologically imposing 4.00 mark could be on the table in the coming months.
Copper Prices Weekly Chart – Retest of Trend Resistance-Turned-Support
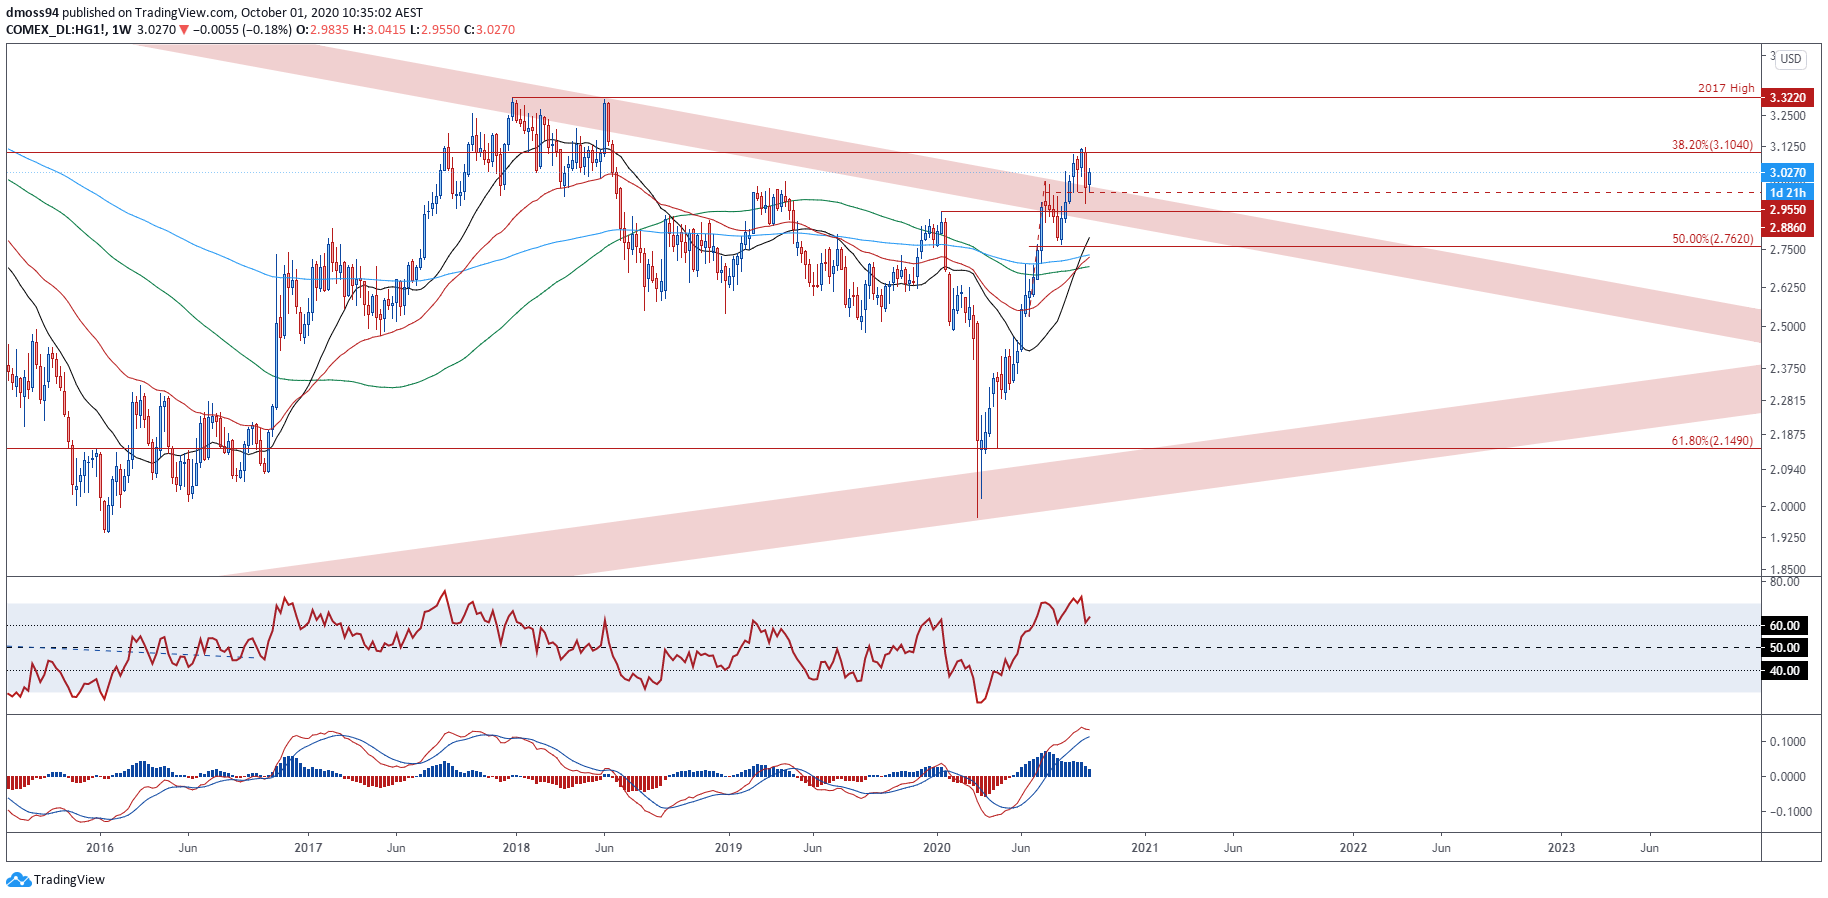
Copper futures (HG) weekly chart created using TradingView
Zooming into the weekly timeframe reinforces the bullish outlook depicted on the monthly chart, with the recent pullback appearing to validate the topside break of the downtrend extending from the 2011 highs.
If support at the July 6 high (2.9170) continues to suppress selling pressure and the RSI retains its constructive positioning above 60, a resumption of the March uptrend looks in the offing.
A weekly close above the yearly high (3.1210) is needed to validate bullish potential and bring the 2017 high (3.3220) into focus.
Copper Prices Daily Chart – 50-DMA Nurturing Uptrend

Copper futures (HG) daily chart created using TradingView
Finally, on a daily timeframe the ductile metal looks to be gearing up to retest the 38.2% Fibonacci (3.1040), despite crashing below Rising Wedge support and the 21-day moving average (3.0294).
The development of the RSI and MACD indicators suggest that an extended push to the upside could be in the making, as both indicators bounce back above their respective neutral midpoints after falling to their lowest levels since August.
Moreover, a ‘golden-cross’ formation –the 100-DMA crossing above the 200-DMA – hints at swelling bullish momentum, which may ultimately result in a push to fresh yearly highs if key psychological resistance at the 3.10 level is successfully breached.
To that end, copper prices look poised to climb higher in the final quarter of 2020, if key support at the psychologically imposing 3.00 mark remains intact.
-- Written by Daniel Moss, Analyst for DailyFX
Follow me on Twitter @DanielGMoss


