Gold Price Forecast:
- Gold prices pushed down to a fresh monthly low this morning.
- Gold prices have been showing bearish tendencies for the better part of the past seven weeks, coming fresh on the heels of all-time-highs that printed in early-August.
- This article focuses in on some key technical criteria, including bearish engulfing patterns, or psychological levels and a long-legged doji. To learn more about these formations as part of price action, please check out our DailyFX Education section.
Gold Price Pullback Continues
Gold prices have continued to sink, further erasing a portion of that extremely bullish move that built in through the summer. Overnight, Gold prices put in an aggressive bearish move to push down to a fresh monthly low, finding a bit of support at a key area on the chart plotted around the 1871 level.
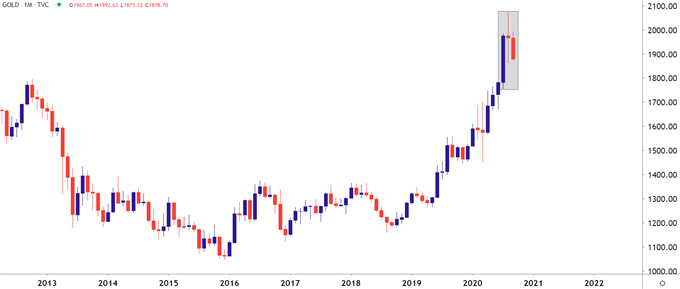
At this point, the monthly chart of Gold is threatening an evening star pattern, which is often followed with the aim of bearish reversals. This would be accented by the long-legged doji that printed for August trade, following the big jump in July as Gold prices began breaking out to fresh all-time-highs. This doji in August has so far been followed by a bearish move in Gold through September, and for the formation to be confirmed – September price action would need to take-out at least half of the July candlestick body. This plots to around 1878.42, which has started to come into play with this recent bearish move.
To be sure, this isn’t the first sign of bearish pressure in Gold prices. I had pointed out the potential for reversal on the very same day that Gold set its current all-time-high, as that fresh high quickly led into the build of a bearish engulfing candlestick on the daily chart. The following week, Gold prices came off with aggression, at one point retracing more than $200. But – even after that move had settled, buyers didn’t yet appear ready to jump back on the bid, at least not to the same degree as to what showed during this summer; and when August price action closed as a doji – highlighting a reversal from aggressive strength that drove a fresh all-time-high into a bearish outlay for the last few weeks of the month – yet another sign was pointing to potential for pullback.
Gold Monthly Price Chart

Chart prepared by James Stanley; Gold on Tradingview
Gold Slips Below Key Supports
Gold bulls have had ample opportunity to continue the move over the past seven weeks, key of which was an August backdrop that offered USD-weakness. And as USD-strength has started to show more prominently in September, there’s been an even greater build of pressure in Gold prices and the yellow metal has slipped below a key area of support on the chart that plots around the prior all-time-high.


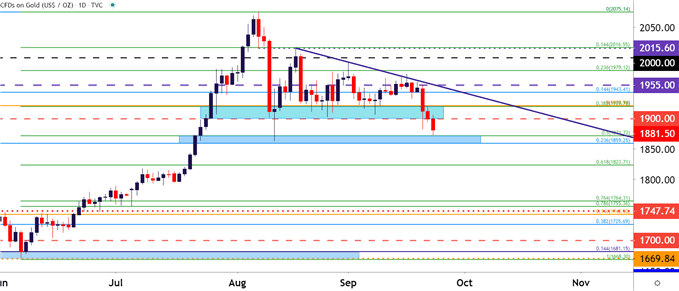
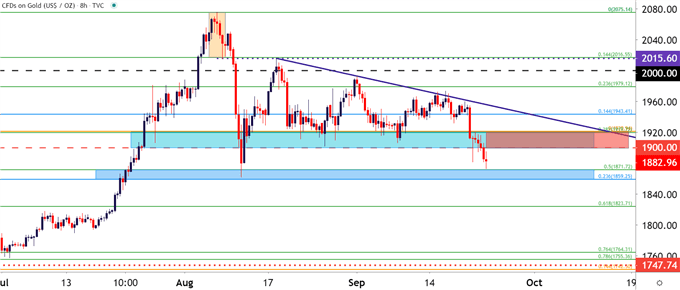
The support zone that runs from the psychological 1900 up to the prior all-time-high of 1920 has helped to hold support in Gold for more than a month, catching multiple inflections and tests along the way. The sell-off on Monday temporarily tested below this zone, but buyers quickly brought price back into this area on the chart, and it held again through yesterday’s trade. But now sellers are swinging with a bit more aggression and price action is perched-below, getting a bit of help on the settlement of support around 1871.72, which is the 50% marker of the June-August bullish run.
Gold Daily Price Chart

Chart prepared by James Stanley; Gold on Tradingview
Gold Price Strategy Moving Forward
There’s now just one week left in Q3 and as the door opens into Q4 a number of themes remain of interest, key of which is the prospect of a stronger US Dollar after the US currency ran into a huge area of chart support in early-September. But, also at issue is the upcoming Presidential Election, a recent shift in FOMC policy and, of course, a brewing pandemic in the background with unknown consequences as the weather turns cooler and flu season approaches.
We’re in some fairly uncharted territory here, which is likely one of the reasons for the explosive move in Gold prices this summer. At that point, the economic response was fairly clear and slowdowns were going to be countered by government stimulus and that liquidity pushed helped to drive risk assets to fresh all-time-highs, like Gold or the Nasdaq or even the S&P 500.


But now? A litany of questions permeates the backdrop as little looks settled in Washington and this November’s election is lining up to be extremely contentious. This makes the fundamental side of Gold perhaps even more unpredictable than normal – which means that traders utilizing techs can incorporate more of a reversal/breakout approach as opposed to waiting for smooth trends to develop.
At this point, current support as noted above is coming in around the 50% marker of the June-August major move, and just below that is another key level of interest at 1859.25. This is the 23.6% retracement of the 2018-2020 major move. This price along with the 1871 level helped to catch the sell-off in early-August and this is the next support zone of interest for current price action.
On the resistance side of the coin, that prior zone of support from 1900-1920 looms large, and above that is another level of interest around 1943.41.
Gold Eight-Hour Price Chart

Chart prepared by James Stanley; Gold on Tradingview
--- Written by James Stanley, Strategist for DailyFX.com
Contact and follow James on Twitter: @JStanleyFX


