


Gold Price Analysis Talking Points:
- Gold prices started off the week with a bang, rallying up to fresh seven-year-highs.
- Buyers shied away before a test of the 1750 level, and a short-term range has since begun to build.
Gold Prices Jump to Fresh Seven-Year-High – Now What?
The week started off with a bang for Gold prices as Monday and Tuesday saw the yellow metal push up to fresh seven-year-highs. Gold price action made a fast approach at the 1750 marker, but fell a bit shy as that newly-printed high came in at 1747.74; after which a pullback showed as Gold prices built into a short-term range formation as looked at on the hourly chart below.
Gold Price Hourly Chart

Chart prepared by James Stanley; Gold on Tradingview
Gold Bulls Back in Charge After March Malaise?
Gold prices have had some form of a bullish big picture backdrop since Q4 of 2018; right around the time the Federal Reserve was nearing an end of the hiking cycle and growing closer to making rate cuts as they did three separate times in the second-half of 2019. As this was happening, with the FOMC shifting towards more neutral language in Q1 and towards more supportive language in Q2, Gold prices popped-higher, with the bullish breakout gaining considerable momentum in the summer of last year. As the Fed neared a pause, Gold prices put a pause on the bullish trend, digesting from early-September into mid-December; but as the door opened into 2020 another series of risks took over the backdrop to help propel Gold prices up to higher-highs.

With the early-year threat of escalation between Iran and the United States to go along with a brewing trade war, Gold prices held the bid. But in mid-to-late February buyers took hold again as fears from the brewing spread of coronavirus began to take hold; once again, propelling gold prices higher.
But in mid-March, Gold got hit, along with a number of other global markets as a cash crunch took place. Gold prices dropped by almost 15% in less than ten trading days as investors hurried into cash or cash-like investments, even as the Federal Reserve and Treasury departments were launching a plethora of stimulus in the effort of offsetting the coronavirus-related slowdowns.
Support eventually showed up around the 1450 level, which is the same area that had helped to hold the Q4 lows last year; and over the past few weeks buyers have made a pronounced re-entry back into the market, bringing on those fresh seven-year-highs that were set on Tuesday of this week.
Gold Price Daily Chart
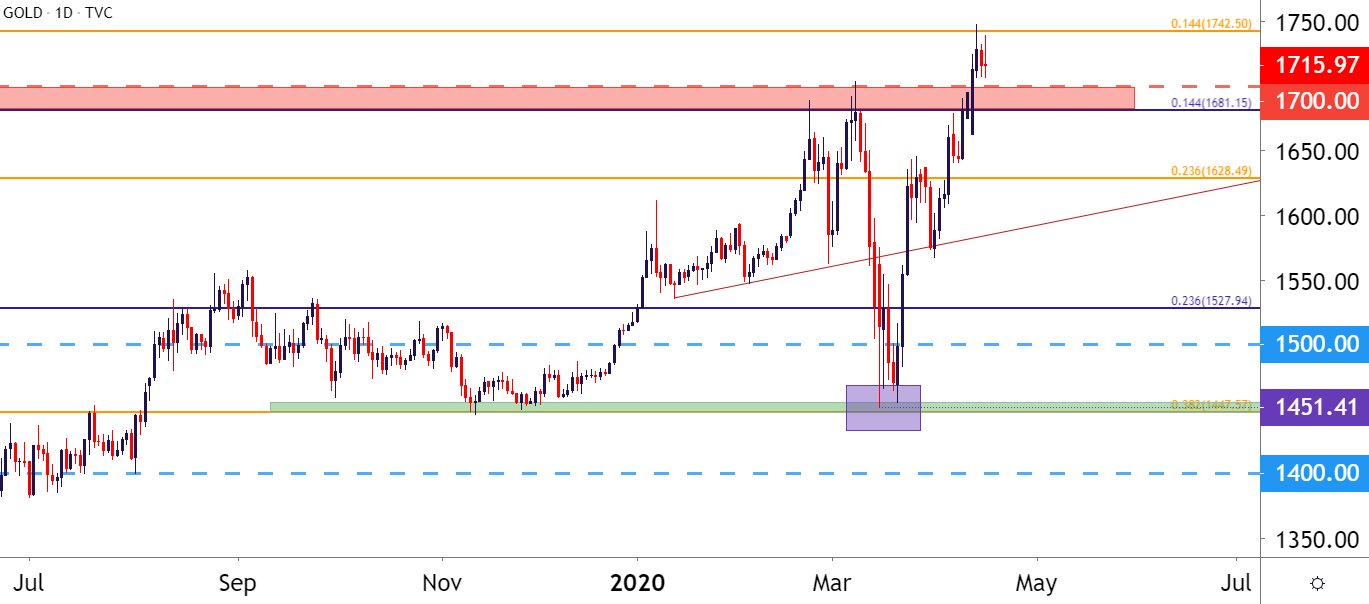
Chart prepared by James Stanley; Gold on Tradingview
Gold Strategy
At this point, the bullish trend remains fairly well-defined given the recent print of seven-year-highs. The bigger quandary facing the trader at the moment is whether or not to chase the move as price action is perched so close to those recent high watermarks.
| Change in | Longs | Shorts | OI |
| Daily | 1% | -3% | -1% |
| Weekly | 2% | -8% | -2% |
There is the potential for a deeper pullback, particularly given the fact that a zone of prior resistance lurks just below the current short-term support. That prior resistance runs from 1681.15 up to the 1700 psychological level; and below that is another potential support zone running from the approximate 1628 up to around 1640.
Gold Four Hour Price Chart

Chart prepared by James Stanley; Gold on Tradingview
--- Written by James Stanley, Strategist for DailyFX.com
Contact and follow James on Twitter: @JStanleyFX


