


Gold Price Analysis:
- The month of March was vicious throughout financial markets, and Gold prices put in a formation highlighting extreme uncertainty on the monthly chart.
- The March range in Gold was almost 15% (14.8%, to be exact).
- While coronavirus slowdowns are showing in some of the largest economies on Planet Earth, Central Banks have rushed into markets with a historical level of accommodation, which helps to explain the reason behind that uncertainty. The more pressing matter for traders is which side might continue to show through the start of Q2.
Gold Puts in Massive Move in March, but Goes Nowhere on Net
The book is now closed on Q1 of 2020 and, for probably most people out there, that’s a fact to be thankful for. It was a historically bad quarter for a number of reasons; both from an economic and a humanitarian perspective. In the Dow Jones Industrial Average, the index lost approximately 23%, marking for the worst Q1 in the index’s history and the worst quarterly outing since 1987 around the S&L crash. The S&P 500 was down a more moderate 20%; and this was the worst quarter in that index since the Financial Collapse.
In response, global governments tried to rush to the aid of their local economies with a number of stimulus programs and Central Bank initiatives in the effort of stemming the near-certain slowdown that would emanate from wide-scale shutdowns and social distancing strategies. This is just now beginning to show in economic data and, likely, this will continue to show in the weeks and months ahead.
Normally, a risk factor of this nature would be expected to bring strength into Gold prices, driven by the anticipation that Central Banks around-the-world would keep the printing presses running in an effort of providing ample liquidity to global markets… but that didn’t happen last month in Gold prices. Gold took a massive hit after the emergency rate cut out of the FOMC, which was coupled with an announcement of stimulus. Gold price action cratered from a test above the 1700 level all the way down to the 1450 neighborhood – a move of 14.8% in a ten days. A portion of that sell-off was clawed back later in March, making for a long-legged Doji on the monthly chart, which highlights extreme indecision in a market.
Gold Monthly Price Chart
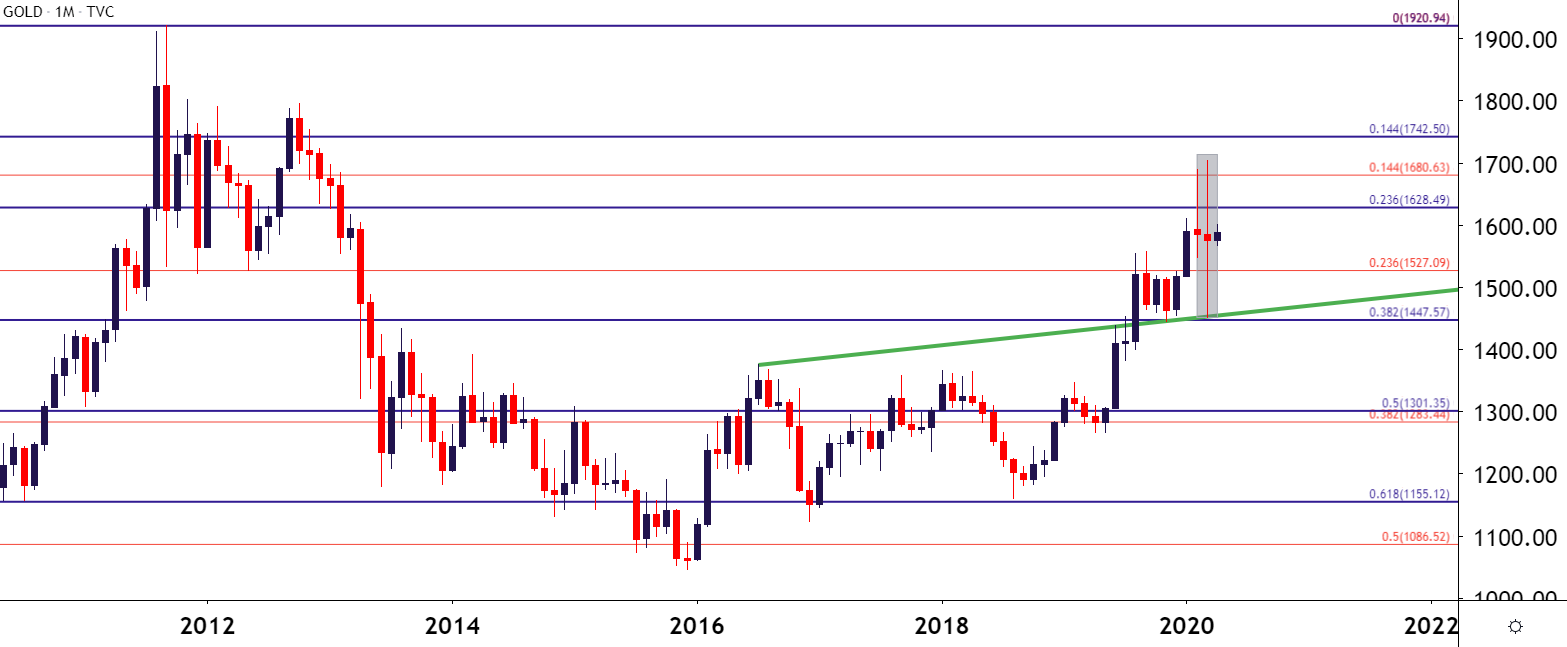
Chart prepared by James Stanley; Gold on Tradingview
Taking a shorter-term look at the matter, unfortunately, doesn’t offer much more for trend biases as recent price action has been vicious on both sides of the market. There has, however, been some form of adherence to some longer-term technical studies that may continue to provide some workable intelligence. Last month’s lows sync with the November, 2019 swing lows, and this comes in around the 38.2% Fibonacci retracement of the 1999-2011 major move.

Resistance, on the other hand, has now shown twice in the zone that runs from 1680-1700, the former of which is the 14.4% retracement of the 2008-2011 major move.
Gold Daily Price Chart

Chart prepared by James Stanley; Gold on Tradingview
While March price action takes on the appearance mean reversion, traders would likely want to be very careful with range strategies in Gold markets, especially given the long-legged doji that printed last month, which may be highlighting a significant break in one direction or the other in the weeks or months ahead. This can highlight the attractiveness of both breakout and reversal strategies; as trends may not last long enough to allow for re-entry and momentum may run into a brick wall should the tide of the headlines turn in one direction or the other.
Taking an even shorter-term look at the matter, and adding a Fibonacci retracement around the major move that showed up in March, and traders can get some additional levels of interest that could be worked with for either breakout or reversal scenarios. Price action is currently digging into support around the 50% marker of that major move; and the 38.2% retracement sitting just above at 1607 could be a point of interest for follow-through resistance. Beyond that, the 1628 level looms large, this the 23.6% marker from that 1999-2011 major move; after which the zone from 1641-1649 becomes of interest.
| Change in | Longs | Shorts | OI |
| Daily | -2% | -2% | -2% |
| Weekly | 3% | 16% | 10% |
On the underside of current price action, the area around the 1550 level stands out as there was a couple of prior inflections confluent with the 1547 Fibonacci level; and below that the zone from 1510-1516.50 becomes of interest.
Gold Four-Hour Price Chart
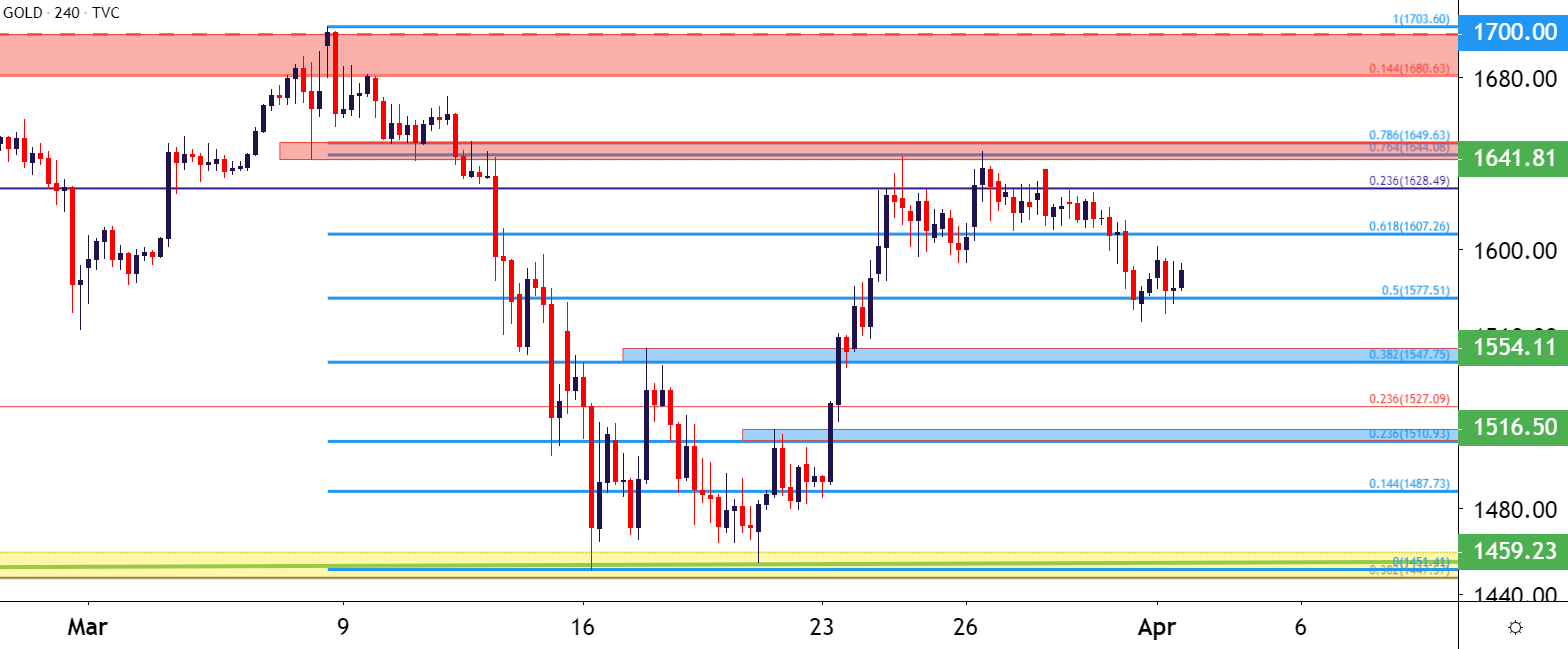
Chart prepared by James Stanley; Gold on Tradingview
--- Written by James Stanley, Strategist for DailyFX.com
Contact and follow James on Twitter: @JStanleyFX


