


Gold Price Technical Analysis
- Gold prices gapped-higher to start this week.
- Fear has driven the Gold bid so far in 2020.
- FOMC rate decision takes place tomorrow at 2PM ET.
Gold Prices Hold Resistance
Gold prices gapped-higher to start this week’s trade, moving along with the general theme of risk aversion that’s continued to show in global markets. The recent driver is the threat of Coronavirus spreading, with US equities starting to show a bit of fear last Friday and that continued through Monday trade. That Friday run of fear also brought another bullish breakout to Gold with price action pushing above the 1567 level of resistance.
But, at this point, S&P futures appear to have garnered some support around a bullish trendline projection and that fear bid may be ready to take a break if not a back-seat altogether. In Gold, prices have built in a quiet range after this week’s opening gap. And while that gap hasn’t yet been filled, there has been a bit of support coming from last week’s resistance, and a bit of scope provided by a Fibonacci retracement produced from the November-January bullish move. The 23.6% retracement helped to produce last week’s highs and currently shows as potential support. And the 14.4% retracement is helping to set this week’s high around the 1587 level.
Gold Price Two-Hour Chart

Chart prepared by James Stanley; Gold on Tradingview
| Change in | Longs | Shorts | OI |
| Daily | 1% | -3% | -1% |
| Weekly | 2% | -8% | -2% |
Gold’s Longer-Term Trend and the Challenge of Short-Term Observations
Current short-term price action quickly moved into overbought levels at the beginning of this year, and RSI even went overbought following last week’s breakout. This extreme bullish drive is likely emanating through an alignment of themes; with expectations around the FOMC to remain loose and passive combining with fear to bring more buyers to the bid in Gold prices. Early-year price action was pushed by fear around escalation between the US and Iran and after that dissipated, fear around the spreading Coronavirus took its place.
This highlights the danger of chasing prices-higher and given the fact that tomorrow brings an FOMC rate decision, the potential for a deeper pullback remains as it doesn’t appear that the bank is near any dovish moves or proclamations.
On the support side of the matter, aggressive strategies can look for a hold around a trendline that’s showed around lows over the past two weeks. This currently projects to 1562-1564. Below that is the prior 2019 swing high which has already shown multiple iterations of support and that comes in at 1557.10. And below that is prior range support, as looked at last Friday, and that comes in around 1548; and if that’s unable to hold, the next big area to follow for support is that same 1535 level that was looked at earlier this month that came in to help set the most recent swing-low.

Gold Four-Hour Price Chart
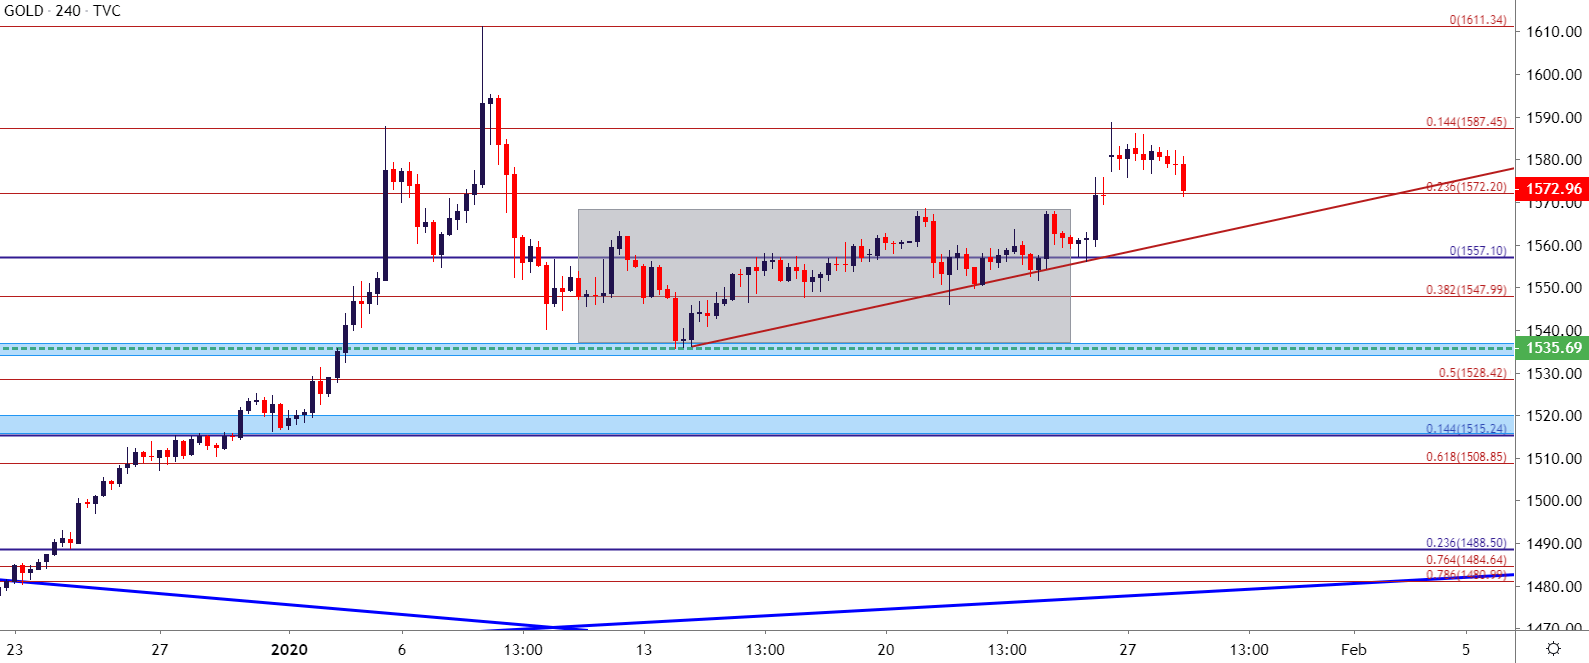
Chart prepared by James Stanley; Gold on Tradingview
--- Written by James Stanley, Strategist for DailyFX.com
Contact and follow James on Twitter: @JStanleyFX


