


Gold Price Talking Points
- Gold prices held the bid through much of this week.
- With another fear-based driver entering the equation, the potential for strength in Gold remains.
Gold prices began the year with a pronounced bullish move, jumping up to yet another fresh six-year-high as tensions between the US and Iran began to show. This isn’t the only bullish driver to Gold prices, of course, as the yellow metal is coming off of a year that saw prices surge by as much as 23% from the February low up to the September high. The big push point from last year appeared to be the Fed and the bank’s shift from a very hawkish stance in 2018 to a dovish stance in 2019, reversing three of the four rate hikes from the year-prior.
But as the Fed indicated that a pause was near, Gold prices settled through Q4 and began to digest that previous breakout, forcing a 38.2% pullback of the summer move. That price came into play in November and helped to set the low around 1445, at which point bulls got back to work, forcing in a series of higher-highs and higher-lows until late-December, at which point price action broke out of the bull pennant formation and continued to run until that fresh high was set on January 8th.
Since then… more digestion, with the recent swing low printing at the 1535 area that was looked at a couple of weeks ago.
Gold Daily Price Chart

Chart prepared by James Stanley; Gold on Tradingview
| Change in | Longs | Shorts | OI |
| Daily | 1% | -3% | -1% |
| Weekly | 2% | -8% | -2% |
Another bullish driver showed up this week and this could be a difficult theme to work with. But as fear began to show around the growing Coronavirus in China, and the potential for it to spread, buyers came back to the bid to push prices higher. While fears around the US and Iran appear to have dissipated in the weeks since that fresh six-year-high, the inclusion of a new, even less predictable driver may help to bring buyers in to support in Gold, even in an environment in which the US Dollar is similarly showing strength. I had discussed this in yesterday’s webinar, as big takeaways from recent price action were strength showing in all of the USD, the JPY and Gold, indicating a hint of risk-off fear.
Nonetheless, from a price action perspective, the net outlay at the moment is yet another bout of digestion that could potentially be approached with a bullish bias. This would be garnered from the fact that horizontal resistance has held the highs this week, coming in around the 1567 level; while support has shown off of a rising trendline taken from January swing-lows.
This takes on the appearance of an ascending triangle formation, which will often be approached with the aim of bullish breakouts. The logic being that each hit at horizontal resistance has brought a lessened impact, as indicated by the rising trendline guiding the higher-lows. And given the bigger-picture backdrop of strength in Gold prices, this may eventually lead to a scenario of trend continuation in the yellow metal; with traders looking for bullish breaks of the 1567.10 resistance to open the door to bullish runs up to 1580 or, perhaps even 1600/1611.

Gold Hourly Price Chart
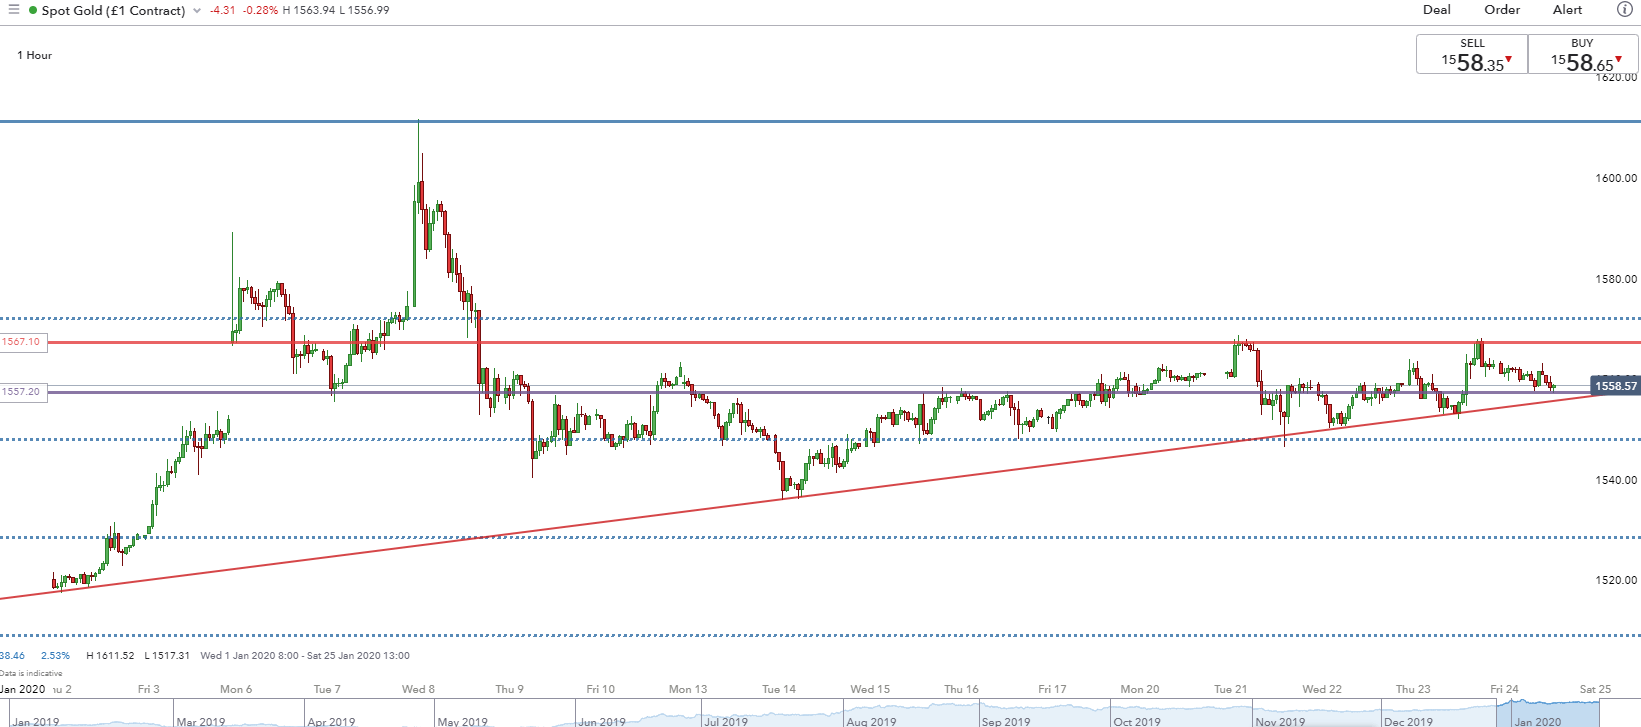
Chart prepared by James Stanley
--- Written by James Stanley, Strategist for DailyFX.com
Contact and follow James on Twitter: @JStanleyFX


