


USD/CAD Talking Points:
- USD/CAD sold off on the heels of last week’s US and Canadian jobs releases, falling from a key level of resistance on the chart.
- Since sellers pulled back from a re-test of the 1.3000 psychological level, USD/CAD has been clawing back prior losses, allowing for the build of an ascending triangle formation. This could point to possible further gains in the pair; and sellers can look for a deeper level of resistance to come into play.
Tues: {{WEBINAR|980972059|Join James' Price Action Webinar.}}
USD/CAD Claws Back Losses from NFP, Canadian Jobs
Last week ended with a quick rush of excitement around the NFP and Canadian jobs releases. While NFP’s printed below expectations Canadian jobs printed in a more positive manner, leading to a downside move in USD/CAD as the US Dollar weakened as the Canadian Dollar gained.
But that move saw sellers slow the approach ahead of a re-test of the 1.3000 psychological level, with support printing at 1.3025; after which buyers began to step back into the equation. That strength has continued to show in a fresh week and price action in USD/CAD is tip-toeing higher, holding a bullish trendline that makes up an ascending triangle formation taken with last week’s resistance.
That resistance showed at a confluent area on the chart, taken from around the 1.3100 level. This price had previously helped to set swing support in mid-December, just before the sell-off that saw the 1.3000 level tested through ahead of year-end.
USD/CAD Eight-Hour Price Chart

Chart prepared by James Stanley; USDCAD on Tradingview

On a shorter-term basis, a series of higher-lows have helped to stem the recent decline in USD/CAD, helping to form a bullish trendline. This trendline, when taken with the horizontal resistance that came into play last week, makes for an ascending triangle formation. Such formations will often be followed with the aim of bullish breakouts, looking for the same motivation that’s brought buyers in at higher-lows to, eventually, carry-over for a breakout through horizontal resistance.
USD/CAD Hourly Price Chart
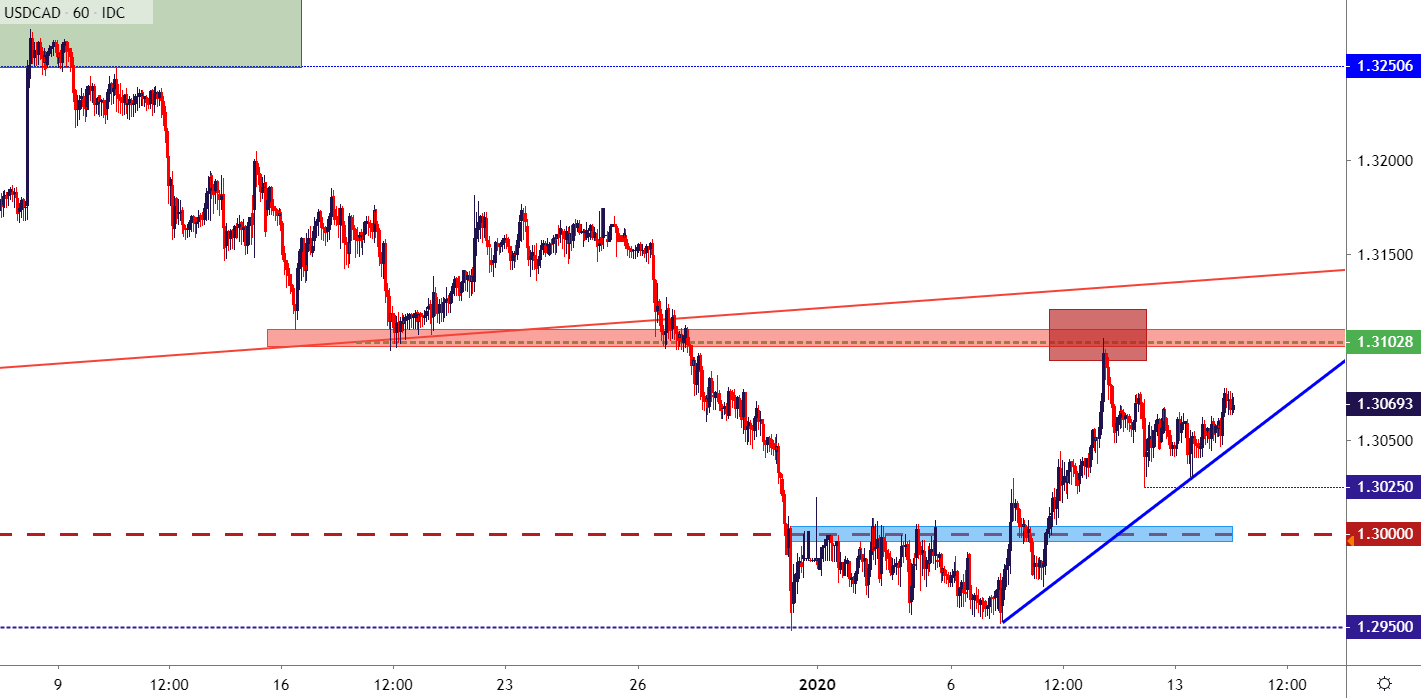
Chart prepared by James Stanley; USDCAD on Tradingview
Given the backdrop, the potential for further gains appears possible given the build of this short-term bullish formation; and this can keep focus on additional levels of resistance beyond that 1.3100 level that helped to hold the highs last week. Such resistance potential rests around another prior zone of support, taken from the 1.3132-1.3150 area. Above that, another such zone runs from 1.3181-1.3205.
| Change in | Longs | Shorts | OI |
| Daily | -2% | 7% | 5% |
| Weekly | -30% | 38% | 13% |
USD/CAD Four-Hour Price Chart

Chart prepared by James Stanley; USDCAD on Tradingview
--- Written by James Stanley, Strategist for DailyFX.com
Contact and follow James on Twitter: @JStanleyFX


