


US Dollar Price Outlook Talking Points:
- The US Dollar has bounced this week after the Powell-fueled sell-off from last week.
- Markets have high expectations for dovish policy out of the Fed in the remainder of this year, with a 79.1% chance of three rate cuts by the end of the year. But the Fed has so far appeared reticent to signal more than one cut; begging the question as to whether the bank will deliver on market demands for softer policy after the seven hikes pushed through 2017 and 2018.
- DailyFX Forecasts are published on a variety of markets such as Gold, the US Dollar or the Euro and are available from the DailyFX Trading Guides page. If you’re looking to improve your trading approach, check out Traits of Successful Traders. And if you’re looking for an introductory primer to the Forex market, check out our New to FX Guide.
US Dollar Recovers From Powell-Fueled Sell-Off
The US Dollar has had a strong start to the week on the heels of the bearish move that showed-up last week following Jerome Powell’s Humphrey Hawkins testimony. While Chair Powell effectively took on a dovish tone during his trip to Congress, the big question is just how dovish might the Fed get? Markets are pricing in a 100% chance of a cut in July, and rate expectations are looking for more in the remainder of this year, with a whopping 79.1% chance of three cuts by the end of the year.
But at the June FOMC rate decision, when the bank first began to show their expectations for softer policy, the dot plot matrix contained the projection of only one cut in the remainder of 2019. This begs the question as to whether a cut in July will be a one-off after the bank tightened rates a full four times last year and three in the year before that; as somewhat of a normalization effort after over-tightening with seven hikes in 2017-2018. Or – is this the start of something new, with another dovish phase at the Fed that could produce multiple rate cuts in the remainder of this year and perhaps even into next?
Markets do not yet appear to be convinced that this is a trend shift from the Federal Reserve. After a three-day gust of weakness last week, prices in the US Dollar have been bid and USD price action has moved right back to a zone of prior resistance. Correspondingly, US stocks put in a pullback from the fresh all-time-highs that showed-up on the heels of that dovish theme; showing that last week’s excitement has come into focus with that highly-expected rate cut now two weeks away.
US Dollar Eight-Hour Price Chart
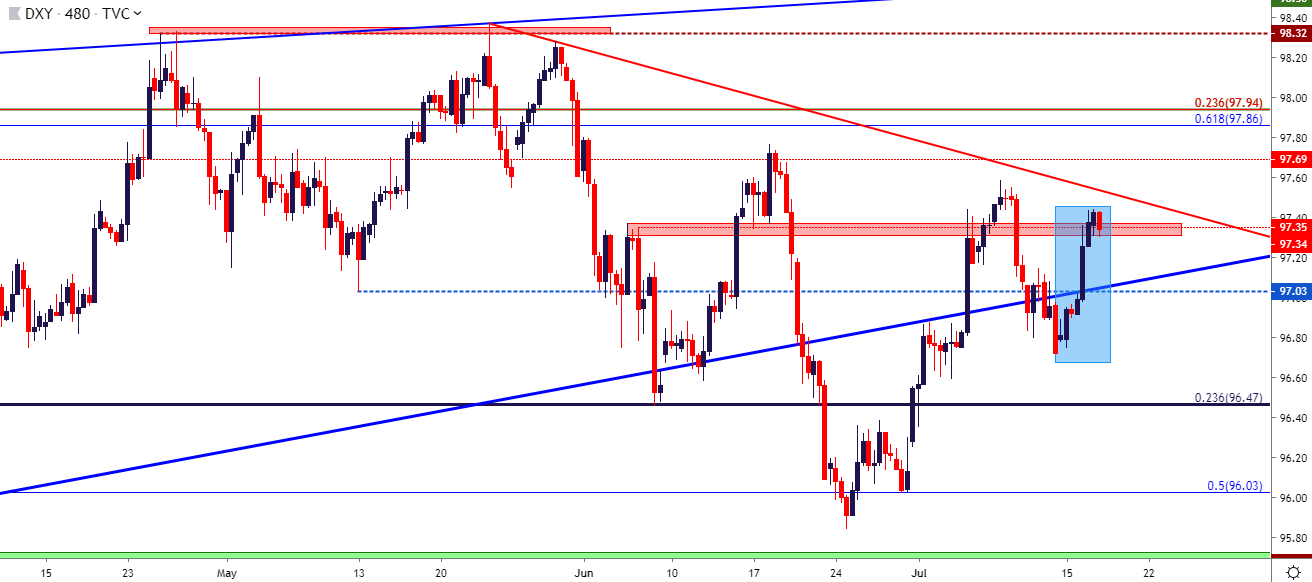
Chart prepared by James Stanley
GBP/USD Plunges to Fresh Two-Year-Low
One market that’s been in a hard trend state has been the British Pound. As fears around No-Deal Brexit have come back into the headlines, sellers have attacked Sterling and when meshed up with that USD-strength from last week, GBP/USD put in a veritable breakdown. I had looked into the pair last Friday, focusing in on two zones of resistance in the effort of catching the lower-high. The zone that runs from 2568-2591 held the Friday high through the Monday open, and yesterday’s spill pushed prices more than 150 pips away.
GBPUSD Two-Hour Price Chart

Chart prepared by James Stanley
Chasing the pair at this point could be a challenge, particularly given the recent penchant for support to show around the 1.2400-handle. One alternative approach could be to wait for the prior 2019 low to come back into play as resistance, and this is around the 1.2442 level. A bit-higher is another area of prior support that could be repurposed as resistance around the 1.2500 handle.
GBPUSD Daily Price Chart
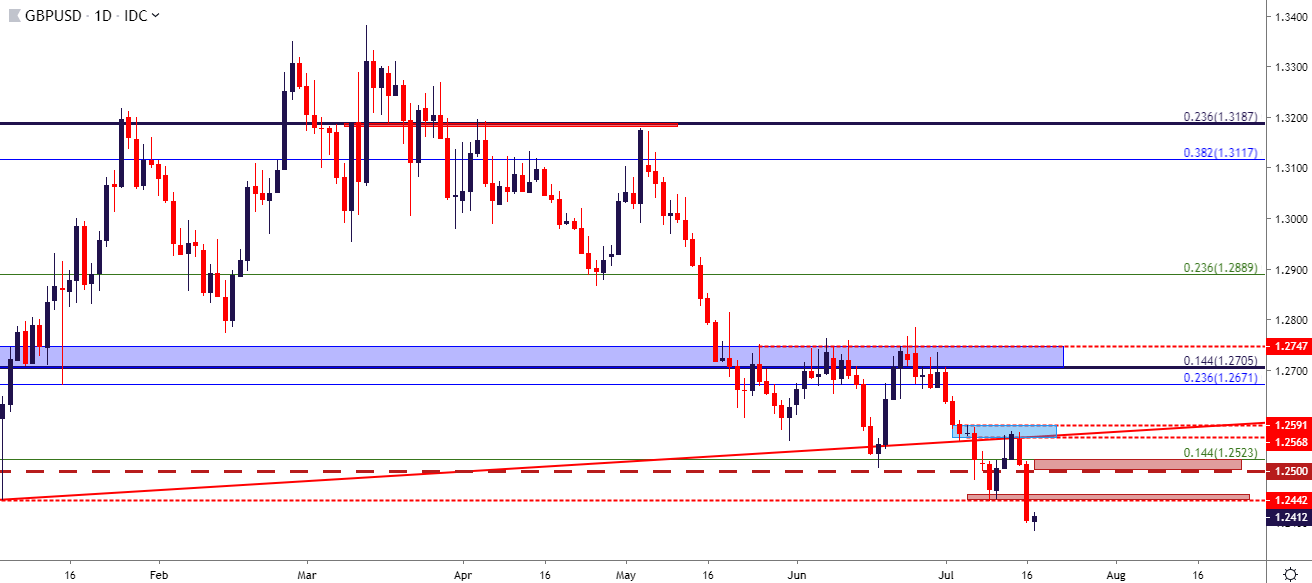
Chart prepared by James Stanley
EUR/USD Back to 1.1212 Support
In contrast to the breakdown in GBP/USD looked at above, EUR/USD has seen a more moderate pullback to a prior zone of support. This is the same zone that’s been in-play as both support and resistance since coming back into the equation in November of last year. More recently, this zone has shown as support over the past month with a series of higher-lows printing. The bottom-portion of the zone at 1.1187 helped to catch the swing-low just ahead of last month’s FOMC rate decision. And then the bullish USD theme that showed into last week’s Humphrey Hawkins testimony produced another higher-low, and so far with this current round of USD-strength, yet another.
If this higher-low support can hold, this keeps the door open for bullish strategies in EUR/USD, and this could remain as one of the more attractive short-USD options amongst major currency pairs given current technical construction.
EUR/USD Eight-Hour Price Chart

Chart prepared by James Stanley
AUD/USD Finding Support at Old Resistance – Flip Potential
A UDUSD has been on my radar for long-USD plays for most of this year, save for a couple of instances when the pair got oversold. The Australian Dollar has remained weak through most of this year on the back of a very dovish RBA that has been cutting rates along with some bleak economic forecasts that haven’t really inspired much positivity. This kept the pair in a bearish state even into last week as prices re-engaged with a resistance zone that runs from .7000-.7020; but something different has started to show and this may have some continuation potential.
That zone of prior resistance has now started to show as support. Bulls have so far defended the 70 big figure even as this rush of USD-strength has shown this week; and if that support can hold, there may be an oncoming bullish theme to work with as the two-month high rests at .7048.
AUD/USD Two-Hour Price Chart

Chart prepared by James Stanley
USD/CAD Re-Tests Resistance After Sellers Shy Away from 1.3000
The short-side theme in USD/CAD has continued to run into this week, with sellers making a strong push towards the 1.3000 psychological level but, up to this point, falling short by about 10 pips. When last month’s USD-weakness after FOMC was priced through markets, USD/CAD caught an additional assist from a strong Canadian Dollar being pushed by a better-than-expected inflation report. While the month of May saw the Bank of Canada make a move towards ‘less hawkish’ monetary policy in the bank’s statement, that inflation release brought the bid in CAD right back. So as USD-weakness was getting priced-in to go along with CAD strength, the pair slid and continued to do so for much of the next month.
At this point, sellers have noticeably shied away from a re-test of the 1.3000 handle. This week’s run of USD-strength has helped the pair to recover up to fresh weekly highs but, at this point, the Fibonacci level at 1.3065 remains in-play. This can keep the door open for short-term bearish strategies looking for a break-down to 1.3000; and if this current area of resistance does not hold, short-side strategies could be re-investigated at the 1.3132 Fibonacci level.
USD/CAD Four-Hour Price Chart

Chart prepared by James Stanley
To read more:
Are you looking for longer-term analysis on the U.S. Dollar? Our DailyFX Forecasts have a section for each major currency, and we also offer a plethora of resources on Gold or USD-pairs such as EUR/USD, GBP/USD, USD/JPY, AUD/USD. Traders can also stay up with near-term positioning via our IG Client Sentiment Indicator.
Forex Trading Resources
DailyFX offers an abundance of tools, indicators and resources to help traders. For those looking for trading ideas, our IG Client Sentiment shows the positioning of retail traders with actual live trades and positions. Our trading guides bring our DailyFX Quarterly Forecasts and our Top Trading Opportunities; and our real-time news feed has intra-day interactions from the DailyFX team. And if you’re looking for real-time analysis, our DailyFX Webinars offer numerous sessions each week in which you can see how and why we’re looking at what we’re looking at.
If you’re looking for educational information, our New to FX guide is there to help new(er) traders while our Traits of Successful Traders research is built to help sharpen the skill set by focusing on risk and trade management.
--- Written by James Stanley, Strategist for DailyFX.com
Contact and follow James on Twitter: @JStanleyFX


