


Crude Oil Price Outlook Talking Points
- Oil prices gapped-up to start Q3 trade, but sellers quickly came back to push prices back below the psychological 60 level.
- The confluent zone of resistance looked at last week continues to hold, and this is despite a seemingly bullish backdrop in which OPEC extended production cuts, combined with the potential for geopolitical tensions in the Middle East.
- DailyFX Forecasts are published on a variety of markets such as Gold, the US Dollar or the Euro and are available from the DailyFX Trading Guides page. If you’re looking to improve your trading approach, check out Traits of Successful Traders. And if you’re looking for an introductory primer to the Forex market, check out our New to FX Guide.
Crude Oil Prices Grind at Confluent Resistance
The week started with strength in crude oil prices as a bullish gap showed after open with buyers continuing to push beyond the psychological level of 60. But that move could not last and buying pressure soon dried up, allowing for price action to fall back below the confluent zone of resistance that’s been in-play for the past week. This area comes in around the 60-handle, with an assist from the Fibonacci level at 59.64 (50% of the October-December 2018 trend) and a bearish trend-line as taken from April and late-May swing-highs.
WTI Crude Oil Daily Price Chart
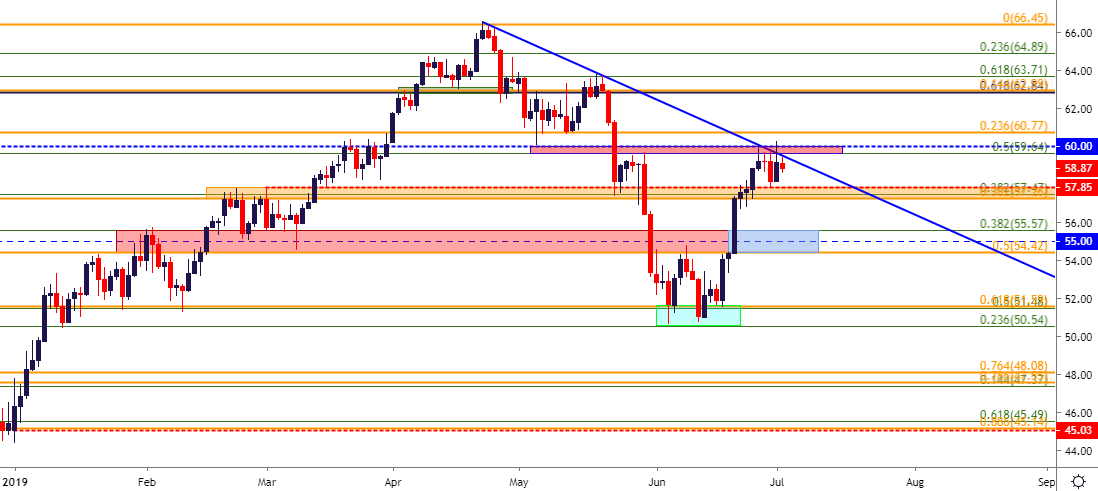
Chart prepared by James Stanley
The late-portion of last week saw a quick flicker of weakness as bears posed a push down to key support. The support zone identified in the previous technical write-up on crude oil, spanning from 57.26-57.85, helped to arrest that decline last week with support holding into the close. That led-in to this week’s bullish gap, but given the recent inflection, this could be an area of interest for near-term support.
WTI Crude Oil Hourly Price Chart

Chart prepared by James Stanley
WTI Crude Oil Strategy
As looked at last week, given a hold of this key area on the chart, and the attraction could remain around short-side swing strategies in crude oil. The past two weeks have produced a backdrop seemingly conducive to bullish themes, marked by a dovish pivot at the Fed, a flare of geopolitical tension between Iran and the US and the extension of production cuts out of OPEC. Collectively, these factors point to continued topside, but that simply has yet to show given price action’s continued grind at this key area of resistance.
For short-side strategies, that zone of support looked at above, the same that came into play on Friday of last week, could function as initial targets for bearish approaches. Beyond that, a zone of prior resistance has yet to be tested for support since prices broke-higher two weeks ago, and that runs around the 55-level, with help from Fibonacci levels at 54.42 and 55.57.
WTI Crude Oil Eight-Hour Price Chart
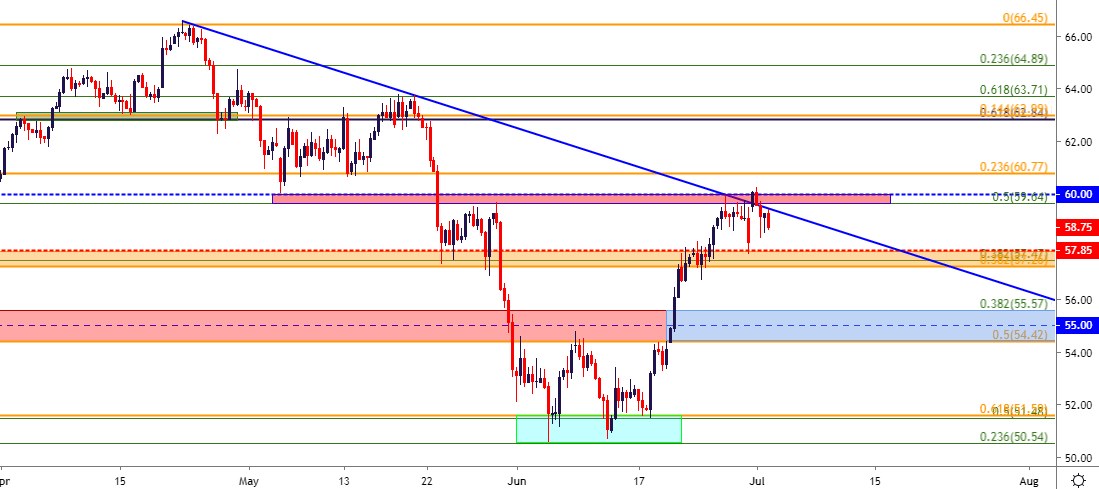
Chart prepared by James Stanley
WTI Crude Oil – Bullish Potential
Given the backdrop, bullish prospects could potentially show, particularly if buyers are able to push through the current area of confluent resistance. For this approach, traders would likely want to see some element of confirmation given the lack of topside response to the current set of drivers, and a Fibonacci level nested at 60.77 can be of help. If buyers are able to break through the current zone of resistance, secondary resistance could be sought out at 60.77, after which higher-low support potential could be re-assigned to the current zone of resistance that runs from 59.64-60.00. Topside continuation strategies could then look at targets around the confluent zone that rests around 62.84-62.89.
WTI Crude Oil Two-Hour Price Chart
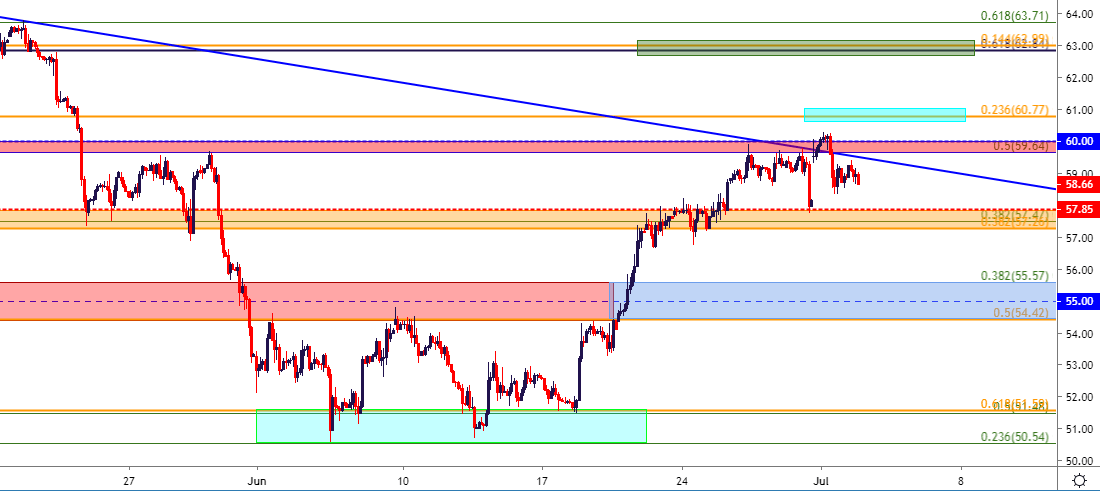
Chart prepared by James Stanley
To read more:
Are you looking for longer-term analysis on the U.S. Dollar? Our DailyFX Forecasts have a section for each major currency, and we also offer a plethora of resources on Gold or USD-pairs such as EUR/USD, GBP/USD, USD/JPY, AUD/USD. Traders can also stay up with near-term positioning via our IG Client Sentiment Indicator.
Forex Trading Resources
DailyFX offers an abundance of tools, indicators and resources to help traders. For those looking for trading ideas, our IG Client Sentiment shows the positioning of retail traders with actual live trades and positions. Our trading guides bring our DailyFX Quarterly Forecasts and our Top Trading Opportunities; and our real-time news feed has intra-day interactions from the DailyFX team. And if you’re looking for real-time analysis, our DailyFX Webinars offer numerous sessions each week in which you can see how and why we’re looking at what we’re looking at.
If you’re looking for educational information, our New to FX guide is there to help new(er) traders while our Traits of Successful Traders research is built to help sharpen the skill set by focusing on risk and trade management.
--- Written by James Stanley, Strategist for DailyFX.com
Contact and follow James on Twitter: @JStanleyFX


