


Gold Price Talking Points:
- Gold prices have set a fresh 2019 low this morning, and this comes even as the US Dollar struggles around the 97.00 level. Support is hanging, albeit by a thread, from the 38.2% retracement of the August-February bullish move, around the level of 1275.55 on the Gold Price Chart.
- The big question is whether this bearish breakout has continuation potential, and that can be a difficult theme to continue without USD participation. This presents setups on either side of Gold prices.
- DailyFX Forecasts are published on a variety of currencies such as the US Dollar or the Euro and are available from the DailyFX Trading Guides page. If you’re looking to improve your trading approach, check out Traits of Successful Traders. And if you’re looking for an introductory primer to the Forex market, check out our New to FX Guide.
Do you want to see how retail traders are currently trading Gold prices? Check out our IG Client Sentiment Indicator.
Gold Prices Break Down – Set Fresh 2019 Low
The US Dollar has not been particularly strong of late, but a trader might not know that by looking at a chart of Gold prices as the yellow-metal has been plummeting so far this week, extending a move that began around last week’s Wednesday releases of the ECB rate decision and FOMC meeting minutes.
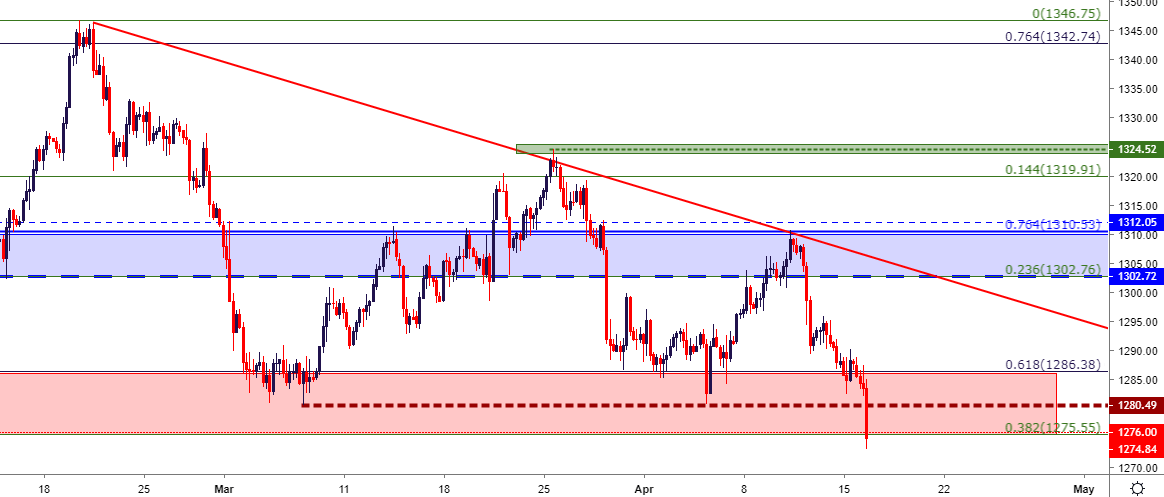
Going into that outlay, Gold prices had remained strong, angling-up for a test of Fibonacci resistance at 1310.53. But, since then, it’s been largely a one-way show as Gold price action first staged a re-test of key 2019 support, and this was from a zone that’s been holding the lows in Gold since January. That support held through the open of this week; but bears were unwilling to wait any longer as a visible downside break began to show this morning, and at this point, Gold prices are trading at fresh 2019 lows.
There is a bit of a support response around the 1275 level, however, as the price of 1275.55 is the 38.2% Fibonacci retracement of the August-February bullish move in Gold prices.
Gold Price Eight-Hour Chart

Gold Price Descending Triangle Filling-In
In our piece last week, a case was investigated on each side of Gold prices. On the bullish side of the argument, prices had just re-engaged with a key zone of support – and if bulls did return, the door could remain open for the same theme of bullish continuation that drove Gold prices in the first six weeks of this year.
On the other side, prices had been filling-in a descending triangle formation over the prior month, consisting of horizontal support from the same 2019 zone to go along with a descending trend-line taken from February, March and now April swing-highs. That formation has already begun to work as sellers have pushed below the horizontal support looked at last Friday around the 1280.50 level.
Gold Price Four-Hour Chart
Gold Downside Break – Missing a Driver
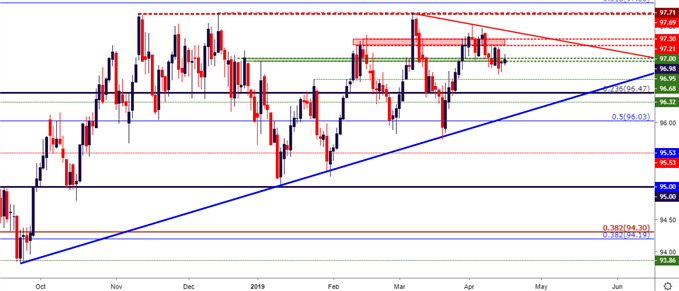
Noticeably missing in this bearish breakout is a show of strength in the US Dollar. USD continues to struggle around the 97.00 level, making this breakdown in Gold all-the-more-impressive. As discussed coming into Q2, the US Dollar continues to carry a bullish backdrop given the ascending triangle that’s been forming for the past five months. That theme appears to remain on pause, at least for now, as bulls have shown little desire to re-test the 97.71 high in DXY.
This provides a bit of context on the move in Gold: If the US Dollar is going to continue to struggle at the 97.00 level or, perhaps even retrace a bit deeper within this longer-running ascending triangle, downside continuation strategies in Gold could be a challenge. However, if USD-bulls do come back to the table anytime soon, deeper supports in Gold are exposed around the 1260 and 1250 levels.
US Dollar Daily Price Chart
Gold Price Near-Term Strategy
At this stage, a hold (as defined by a Daily close) of support around the 38.2% Fibonacci retracement at 1275.55 could keep the door open for topside strategies in Gold. This would largely be driven by the expectation for the US Dollar to continue struggling around resistance, looking for a deeper retracement in USD in the second-half of April.
On the bearish side of Gold prices, traders have a few options of moving forward. The more conservative path would be one of patience, waiting for the Fibonacci level to get taken-out, at which point prior areas of short-term support could be re-utilized as resistance. The two obvious levels for such an approach would be around the prior horizontal area of 1280.50, and the Fibonacci level a bit-deeper around 1286.38.
Gold Price Two-Hour Chart

Chart prepared by James Stanley
To read more:
Are you looking for longer-term analysis on the U.S. Dollar? Our DailyFX Forecasts for Q2 have a section for each major currency, and we also offer a plethora of resources on USD-pairs such as EUR/USD, GBP/USD, USD/JPY, AUD/USD. Traders can also stay up with near-term positioning via our IG Client Sentiment Indicator.
Forex Trading Resources
DailyFX offers an abundance of tools, indicators and resources to help traders. For those looking for trading ideas, our IG Client Sentiment shows the positioning of retail traders with actual live trades and positions. Our trading guides bring our DailyFX Quarterly Forecasts and our Top Trading Opportunities; and our real-time news feed has intra-day interactions from the DailyFX team. And if you’re looking for real-time analysis, our DailyFX Webinars offer numerous sessions each week in which you can see how and why we’re looking at what we’re looking at.
If you’re looking for educational information, our New to FX guide is there to help new(er) traders while our Traits of Successful Traders research is built to help sharpen the skill set by focusing on risk and trade management.
--- Written by James Stanley, Strategist for DailyFX.com
Contact and follow James on Twitter: @JStanleyFX


