


Talking Points:
- This morning’s release of Non-Farm Payrolls data for the month of July came in below expectations, printing at +157k versus the expectation of +193k. Average Hourly Earnings printed at the expectation of an annualized 2.7% while the unemployment rate dropped back-below 4% to come-in at the expected 3.9%.
- The US Dollar has put in a bullish week, starting off at a key area of support and jumping up to resistance in the aftermath of the FOMC rate decision. DXY is currently holding above the 95.00 level that’s had a tendency to turn around bullish advances over the past couple of months. Inflation data sits on the calendar for next week, and this is the singular factor that could likely drive the USD out of this resistance zone.
- DailyFX Forecasts on a variety of currencies such as the US Dollar or the Euro are available from the DailyFX Trading Guides page. If you’re looking to improve your trading approach, check out Traits of Successful Traders. And if you’re looking for an introductory primer to the Forex market, check out our New to FX Guide.
Do you want to see how retail traders are currently trading the US Dollar? Check out our IG Client Sentiment Indicator.
Headline NFP Misses Expectations; Unemployment Rate, Average Hourly Earnings In-Line
This morning brought the release of July jobs numbers out of the US, and Non-Farm Payrolls for last month came in at +157k versus an expectation of +193k. The unemployment rate dropped and hit the expected 3.9% print, while Average Hourly Earnings also printed in-line with expectations at 2.7%.
This morning’s report was released after the US Dollar continued to show strength following yesterday’s move into a zone of resistance that’s held the highs in the Greenback since late-May. Prices have posed multiple attempts to break out beyond this area over the past couple of months but, to date, each has failed. With next week’s US inflation data on the docket for Friday, we may be looking at a backdrop that could support a move to fresh highs, particularly if we see higher-low support catch at some point today or early next week.
US Dollar in the Resistance Zone, Can US Dollar Bulls Push Through to Fresh Highs?

Chart prepared by James Stanley
Next week’s calendar is quite a bit more calm than the outlays that we had over the past couple of weeks. With major Central Banks having reported rate decisions out of Japan, the UK, Europe and the US – attention now shifts towards data in the effort of reading what those next rate decisions might bring (in terms of guidance and projections). Inflation in the United States has remained on a steady trend of strength, and this leads into next week’s inflation release in which markets are looking for that strength to continue growing with a 3% print.
US Inflation Remains Elevated Above the Fed’s Target, Expected to Continue Growing
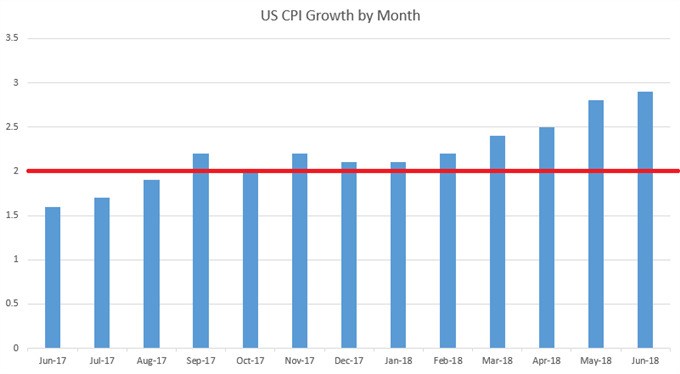
Chart prepared by James Stanley
The highlight of next week’s economic calendar is US inflation data set to be released on Friday. The expectation is for a 3% print, and this would echo the continued gains that’s been seen in that data point throughout this year. This could also solidify that backdrop for continued hawkishness at the Federal Reserve as the bank looks for an additional two hikes in 2018 and three more rate hikes in 2019, while the ECB and BoE may be looking at one rate hike each during the same span.
DailyFX Economic Calendar: High-Impact Events for the Week of August 6th, 2018

Chart prepared by James Stanley
US Dollar Strength Continues as DXY Runs From Support to Resistance
Probably the biggest takeaway from price action this week was the bullish move in the US Dollar. The USD came into the week testing a key area of confluent support, taken from a trend-line connecting the June and July lows which ran into a pair of Fibonacci levels that have been helping to support prices. That bounce started rather visibly on Tuesday, and through the FOMC rate decision on Wednesday and the BoE rate decision yesterday, that theme continued to show and DXY ran up to the 95.00 level.
We’ve since started to pull back, but the big question now is whether buyers return to offer-higher low support. There are a couple of shorter-term areas that could be interesting for that higher-low support, taken from last week’s swing highs around 94.84 and Wednesday’s swing-low around 94.50.
US Dollar via ‘DXY’ Four-Hour Price Chart: Higher-Low Support Potential For Bullish Continuation
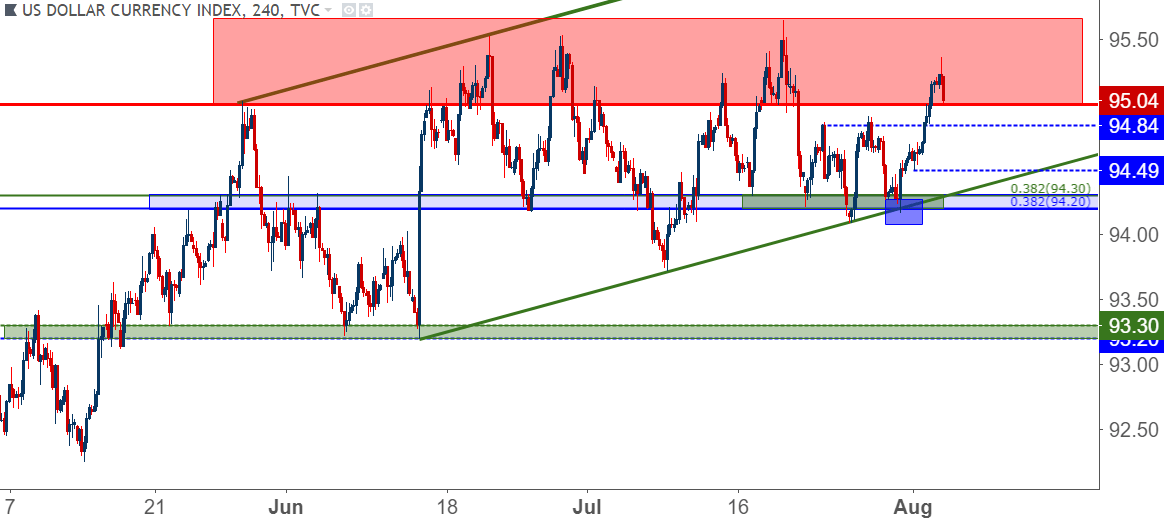
Chart prepared by James Stanley
EUR/USD Breaks Triangle, Finds Resistance on Under-Side of Trend-Line
Euro bears caught a break this week when prices pushed below the symmetrical triangle that’s been building over the past month-and-a-half. The support trend-line of that formation can be found by connecting the June 21st and July 19th swing lows, and after this morning’s pullback in the Dollar, the pair has started to find resistance on the underside of this trend-line:
EUR/USD Two-Hour Price Chart: Short-Term Resistance at Under-Side of Trend-Line
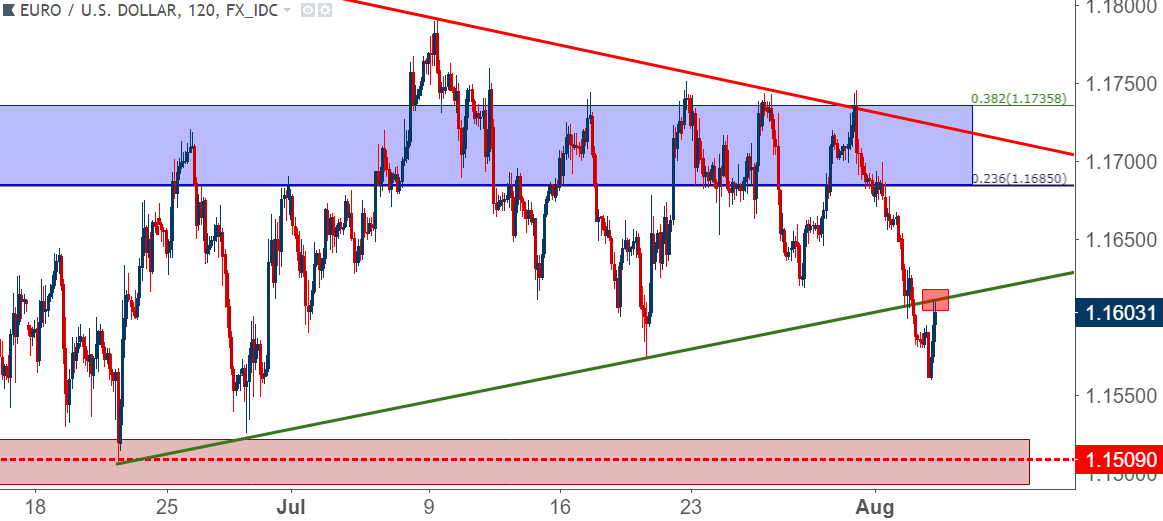
Chart prepared by James Stanley
For those with longer-term stances in the pair, awaiting a deeper break or at the very least, a test of deeper support could open the door for bigger-picture strategies in the pair. The level of 1.1509 twice turned around bearish advances in Q2, first in late-May and again in June after the ECB rate decision. A down-side break of the 1.1500 psychological level can make the prospect of longer-term bearish continuation look considerably more attractive, as we’re still in the very early stages of that shorter-term triangle break.
EUR/USD Daily Price Chart

Chart prepared by James Stanley
GBP/USD: Cable Tests 1.3000 Again
Yesterday’s BoE rate decision appeared to be about as dovish as a Central Bank could be while hiking rates. This showed very visibly in the British Pound as a quick blip of strength that came from the rate hike was quickly erased, and that weakness has continued over the next 24 hours. This has brought upon a second test of the 1.3000 level after a similar instance in mid-July. That previous test failed as sellers dried up while we traded below the psychological level, and traders would likely want to stand on guard for a repeat scenario of the same thing.
This doesn’t necessarily preclude bearish strategies in the pair. But for those looking to establish short-side exposure, they’d likely want to wait for a better level to sell off of, and we look at a couple of those potential areas below. The area around 1.3117 could be especially interesting, as we’ve seen a tendency for price action to build support around this area over the past couple of months. This is the 38.2% Fibonacci retracement of the ‘Brexit move’ in the pair, and if it does come into play as resistance, the door is opened for stops above the 1.3200 swing-high from last week.
GBP/USD Four-Hour Price Chart

Chart prepared by James Stanley
To read more:
Are you looking for longer-term analysis on the U.S. Dollar? Our DailyFX Forecasts for Q1 have a section for each major currency, and we also offer a plethora of resources on USD-pairs such as EUR/USD, GBP/USD, USD/JPY, AUD/USD. Traders can also stay up with near-term positioning via our IG Client Sentiment Indicator.
Forex Trading Resources
DailyFX offers a plethora of tools, indicators and resources to help traders. For those looking for trading ideas, our IG Client Sentiment shows the positioning of retail traders with actual live trades and positions. Our trading guides bring our DailyFX Quarterly Forecasts and our Top Trading Opportunities; and our real-time news feed has intra-day interactions from the DailyFX team. And if you’re looking for real-time analysis, our DailyFX Webinars offer numerous sessions each week in which you can see how and why we’re looking at what we’re looking at.
If you’re looking for educational information, our New to FX guide is there to help new(er) traders while our Traits of Successful Traders research is built to help sharpen the skill set by focusing on risk and trade management.
--- Written by James Stanley, Strategist for DailyFX.com
Contact and follow James on Twitter: @JStanleyFX


