


Talking Points:
- Today at 2PM brings the August rate decision out of the Federal Reserve. This meeting brings no accompanying press conference, nor do we get updated forecasts. With a rate hike expected at the bank’s next meeting in September along with another hike expected in December, today appears to be all about paving the way for those following rate decisions.
- Tomorrow brings the Bank of England for a ‘Super Thursday’ event in which there are strong odds of getting a move. The bigger question is what happens in the BoE’s forecasts, and whether the bank will be looking at any follow-up rate hikes shortly thereafter. Non-Farm Payrolls on Friday is shaping up to be interesting as well, as market participants will be looking for clues of continued strength in the US economy after last week’s release of 2Q GDP at 4.1%.
- DailyFX Forecasts on a variety of currencies such as the US Dollar or the Euro are available from the DailyFX Trading Guides page. If you’re looking to improve your trading approach, check out Traits of Successful Traders. And if you’re looking for an introductory primer to the Forex market, check out our New to FX Guide.
Do you want to see how retail traders are currently trading the US Dollar? Check out our IG Client Sentiment Indicator.
FOMC on Deck
Today at 2 PM Eastern Time brings the August rate decision out of the Federal Reserve. Today’s meeting is all about the statement, as there is no accompanying press conference for this meeting, nor will the bank be releasing updated forecasts. With a rate hike expected in September, today’s meeting appears to be about holding the line, as the Fed will likely try to avoid making any significant splashes. This then brings focus on the remaining portion of this week’s calendar, as we have a Bank of England rate decision tomorrow that does carry strong odds of getting a rate hike, and this is followed by the Friday morning release of Non-Farm Payrolls for the month of July. That NFP report could end up being the most operative USD driver for the week, as clues or hints towards continued economic strength in the US following the 4.1% GDP print for Q2 can help to keep USD Dollar bulls on the bid.
As we approach this afternoon’s rate decision, the Dollar remains in a bullish longer-term structure, although we haven’t made much ground so far in Q3 as DXY continues to range with a slight upward bias. This has largely been the case since late-June, and at this point, there’s no sign or signal of this back-and-forth price action letting up.
US Dollar Four-Hour Price Chart

Chart prepared by James Stanley
On a longer-term basis, that bullish uptrend remains, and that would place focus on near-term support. This near-term support area has been getting tested on multiple occasions over the past two weeks but, as of yet, bulls haven’t been able to pose a sustained break above the 95.00 level on DXY. This may lead to a test through or perhaps even a breach of short-term support, particularly if we see positive drivers show in GBP/USD around tomorrow’s BoE rate decision, or if we see some enthusiasm flow into EUR/USD following yesterday’s inflation data.
This would not necessarily eliminate the potential for bullish setups in USD, as deeper support exists below current price action that could keep the door open for topside strategies. The July swing low of 93.71 could be of interest, as could the June lows that run in the area from 93.20-93.30.
US Dollar Eight-Hour Price Chart

Chart prepared by James Stanley
GBP/USD Holds at Fibonacci Level Ahead of BoE ‘Super Thursday’
Tomorrow’s rate decision at the Bank of England is expected to bring just the second interest rate hike out of the bank in the past decade. This is quite the change-of-pace for a bank that’s harbored a very dovish stance towards policy since the Brexit referendum, which was now 25 months ago. That extreme dovish stance helped to drive considerable weakness in the British Pound after Brexit, and this soon showed up as higher rates of inflation that continued throughout last year and even into 2018.
This had driven the thought that we might be getting a rate hike as we approached the May ‘Super Thursday’ rate decision; but as inflation disappointed in March, those expectations evaporated and weakness showed in the British Pound for the next three months.
GBP/USD Daily Price Chart: A Brutal Reversal in the British Pound Over Past Three Months

Chart prepared by James Stanley
This theme hit fever pitch two weeks ago upon the release of another disappointing inflation report. Inflation for the month of June came in at 2.4% for the third consecutive month – still above the BoE’s 2% target but also well-below the 3% rates of inflation that were seen last year while the bank remained in a dovish stance. This disappointing inflation print helped Cable to finally trade below the vaulted psychological level of 1.3000. But – as GBP/USD tested below this figure, sellers soon dried up, and prices moved-higher as shorts closed out positions ahead of a really big driver that was expected to bring a rate hike.
Since then, more rumors have circulated that the BoE may end up being a bit more-hawkish than what market participants were looking for. This can be accomplished through the forecasts offered by the bank tomorrow. The bigger question is whether they will say anything that might reverse the bearish trend that’s shown in the currency since that mid-April reversal? A considerable amount of risk remains on the horizon for the British Pound with the EU-UK showdown around Brexit negotiations on the calendar just a couple of months away.
At this point, GBP/USD price action is holding at the 38.2% retracement of the Brexit-move around 1.3117. This level has been offering varying forms of support to the pair since late-June when it first came back into play; and while we’ve had numerous tests below, bears haven’t yet been able to sustain a break, indicating that we may need a move-higher first to clear out pre-existing shorts before GBP/USD has the ability to fully trade through 1.3000 – if it does at all.
GBP/USD Weekly Price Chart
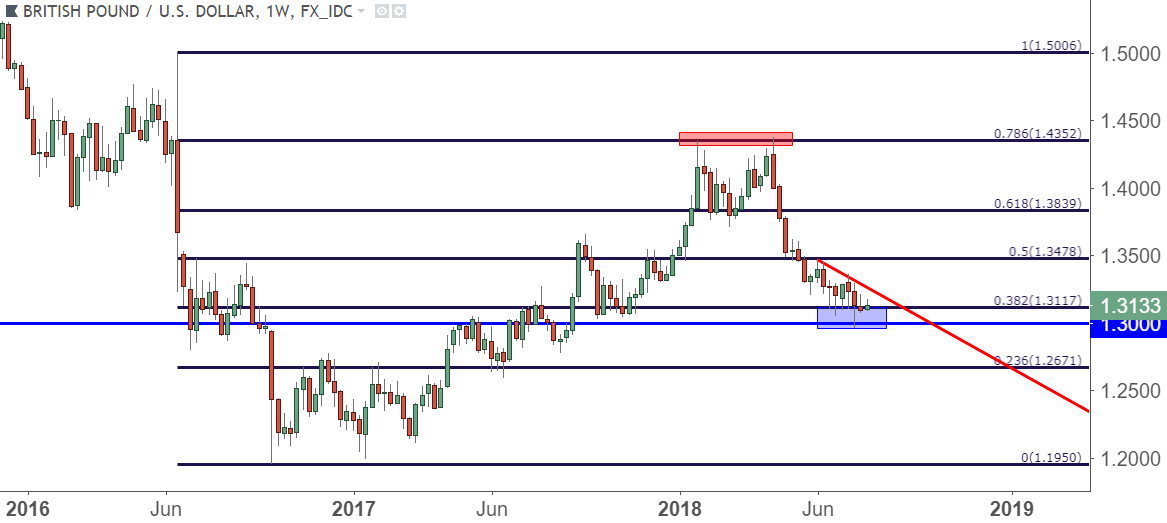
Chart prepared by James Stanley
On a shorter-term basis, the bearish structure in the pair can remain intact up to the 1.3293 swing-high. If we do break through there, a deeper retracement will appear more likely, and this would likely need to be coupled with some element of USD-weakness. But – that brings up the possibility of a longer-term resistance test at the July swing high of 1.3363, or perhaps even the 50% retracement from that same Fibonacci study at 1.3478. Coincidentally, that 1.3478 level is the price that helped to set support after the BoE’s May rate decision in which they did not hike rates.
GBP/USD Four-Hour Price Chart
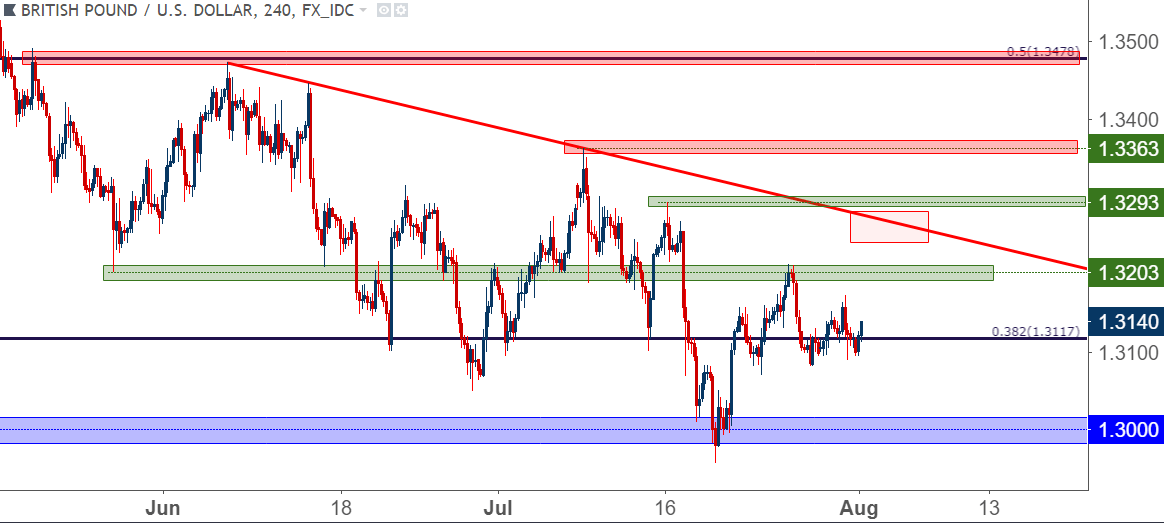
Chart prepared by James Stanley
EUR/USD Digestion Continues – NFP as the Potential Driver
There’s not much new to write about in EUR/USD, as the symmetrical wedge that’s been building for the entirety of Q3 continues to hold price action. We did see a flicker of strength yesterday following that inflation report that showed the highest rate of inflation since December, 2012; but that theme was short-lived as prices soon caught resistance at the top-side of the zone, and has since promptly moved-lower.
There’s not much for significant drivers out of Europe for the remainder of the week. We do get PPI numbers tomorrow and retail sales numbers on Friday; but most likely the driver to break this impasse would be the NFP report on Friday morning.
EUR/USD Four-Hour Price Chart

Chart prepared by James Stanley
USD/JPY Attractive for Long-USD Strategies
We’ve been following the Yen throughout Q3 as weakness started to show again in a rather visible manner. The first quarter of this year was brutal for the BoJ, as rising inflation brought upon thoughts that the bank may find themselves in an ECB-like scenario later this year. But inflation started to pull back in Japan and we’ve now seen three consecutive months below 1%, bringing-back the prospect of the Bank of Japan remaining one of the more passive and loose Central Banks in the world.
That theme caught another shot-in-the-arm this week as the BoJ repositioned their QE strategy. In response, the Japanese Yen weakened and with the current backdrop, the door may be open for more. The Federal Reserve is looking at another two rate hikes this year; the ECB is looking to start tapering their stimulus program in September, and the Bank of England is nearing a widely-expected rate hike. The commonality in all of these scenarios is rising inflation.
The major outlier continues to be Japan, as inflation at .7% keeps the door open for the BoJ to stay loose and passive with monetary policy, and pedal-to-the-floor on the stimulus-front. This can keep Yen-weakness as an attractive theme to FX traders as we trade deeper into 2018.
USD/JPY Daily Price Chart: Bounce From Support after BoJ

Chart prepared by James Stanley
Regarding near-term strategies in USD/JPY, a pullback in USD could be helpful for those looking to take on bullish exposure. There’s higher-low support potential around the 111.40-111.60 area, and this could open the door for stops below the 110.56 swing from last week that marks the three-week low in the pair.
USD/JPY Hourly Price Chart:
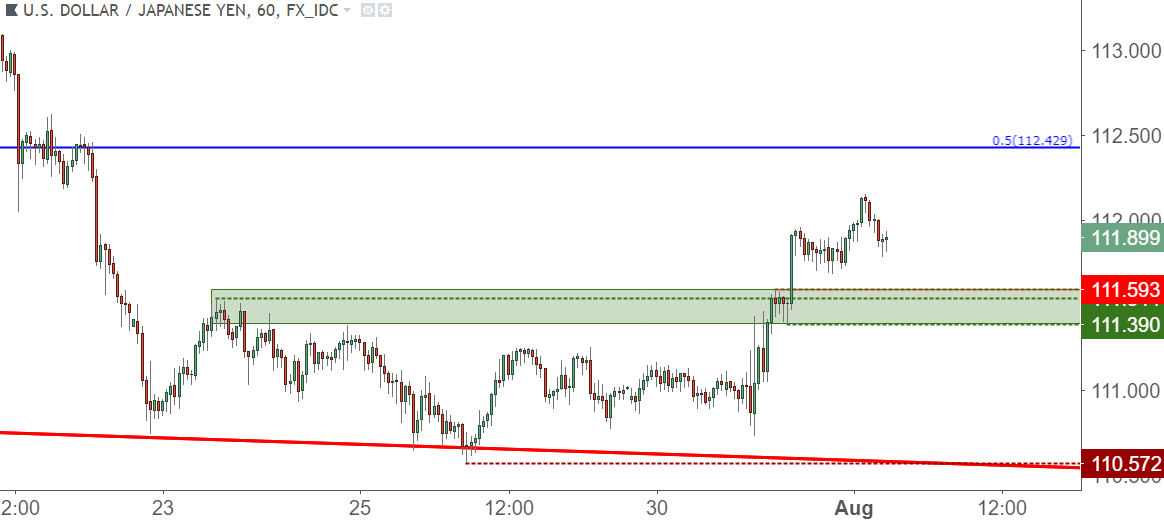
Chart prepared by James Stanley
To read more:
Are you looking for longer-term analysis on the U.S. Dollar? Our DailyFX Forecasts for Q1 have a section for each major currency, and we also offer a plethora of resources on USD-pairs such as EUR/USD, GBP/USD, USD/JPY, AUD/USD. Traders can also stay up with near-term positioning via our IG Client Sentiment Indicator.
Forex Trading Resources
DailyFX offers a plethora of tools, indicators and resources to help traders. For those looking for trading ideas, our IG Client Sentiment shows the positioning of retail traders with actual live trades and positions. Our trading guides bring our DailyFX Quarterly Forecasts and our Top Trading Opportunities; and our real-time news feed has intra-day interactions from the DailyFX team. And if you’re looking for real-time analysis, our DailyFX Webinars offer numerous sessions each week in which you can see how and why we’re looking at what we’re looking at.
If you’re looking for educational information, our New to FX guide is there to help new(er) traders while our Traits of Successful Traders research is built to help sharpen the skill set by focusing on risk and trade management.
--- Written by James Stanley, Strategist for DailyFX.com
Contact and follow James on Twitter: @JStanleyFX


