Talking Points:
- FX Markets continue to show the general theme of congestion as another US Dollar rally has fallen flat. The Greenback is now heading back towards the support zone that runs from 94.20-94.30 on the US Dollar, and this poses challenges for trend-based strategies as we’re nearing almost two full months of congestion in USD price action.
- The highlight of this week’s economic calendar is the ECB rate decision on the docket for this Thursday. Next week brings another couple of key rate decisions that market participants already appear to be positioning for with GBP/USD and the BoE (next Thursday) and USD/JPY and the BoJ (Next Monday night/Tuesday morning).
- DailyFX Forecasts on a variety of currencies such as the US Dollar or the Euro are available from the DailyFX Trading Guides page. If you’re looking to improve your trading approach, check out Traits of Successful Traders. And if you’re looking for an introductory primer to the Forex market, check out our New to FX Guide.
Do you want to see how retail traders are currently trading the US Dollar? Check out our IG Client Sentiment Indicator.
US Dollar, EUR/USD Move Deeper into Digestion Patterns
Congestion continues in the FX market as the Euro has been nudged-higher this morning. Of particular interest to that theme was a set of PMI reports released earlier this morning, with Germany posting a strong beat of the expectation. The expected print of 55.5 was well-eclipsed by the actual print of 57.3, and this helped the Euro to recover from the orderly sell-off that had showed after this week’s open.
EUR/USD 15-Minute Price Chart
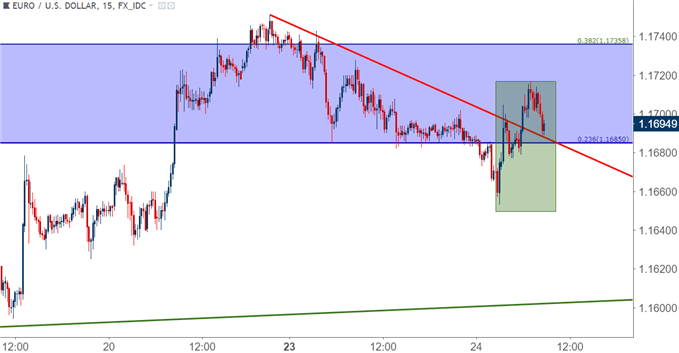
Chart prepared by James Stanley
On a bigger-picture basis, the Q3 congestion in EUR/USD continues as prices have driven deeper within the symmetrical wedge formation that’s been building for the better part of the past two months, and this makes prognosticating trending scenarios around the single currency somewhat of a challenge at the moment as there are a series of drivers on either side of the scenario that can be justified in a multitude of ways.
The next area of potential clarity is the ECB meeting on the docket for Thursday morning. This is the first European Central Bank meeting since the announcement of stimulus taper in June, and this is the first chance for the bank to offer some details around when actual rate hikes may come in. Previously, the ECB said that they anticipate keeping rates at current levels ‘at least through the summer of 2019.’ But – data hasn’t been all that bad since then: We saw inflation come-in at 1.9% for May, and as we saw again this morning, German PMIs remain strong.
Is this the type of backdrop that can support low rates for at least another fourteen months? Or will inflation continue to climb to the point where the ECB has to hustle into action? These are questions that could get a bit of perspective from Mario Draghi at Thursday morning’s ECB press conference.
EUR/USD Four-Hour Price Chart: Lacking Trend, Deeper Within Symmetrical Wedge
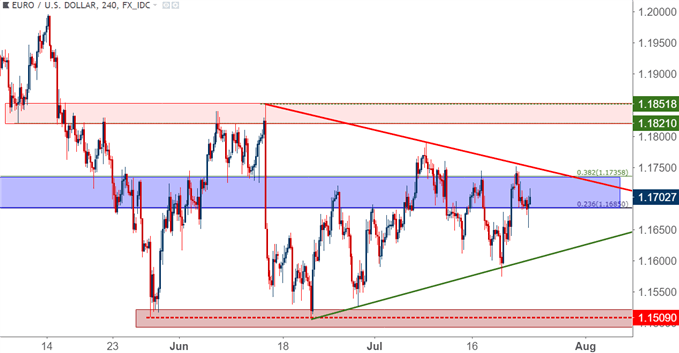
Chart prepared by James Stanley
US Dollar Back Towards Support After Yesterday’s Bounce
Continuing with that theme of greater congestion we have the US Dollar moving back towards support after yesterday’s bullish bounce. That bounce came in from 94.20, which is the 38.2% Fibonacci retracement of the 2017-2018 downtrend in the currency, and this is the bottom-part of a zone that’s shown multiple support and resistance tests over the past couple of months.
If we do see another re-test of this zone today, the door could re-open to bullish strategies in the Dollar, with particular interest around pairs like USD/CAD, or with a bit more development, perhaps even GBP/USD.
US Dollar via ‘DXY’ Four-Hour Price Chart: Re-Approaching Key Support Zone
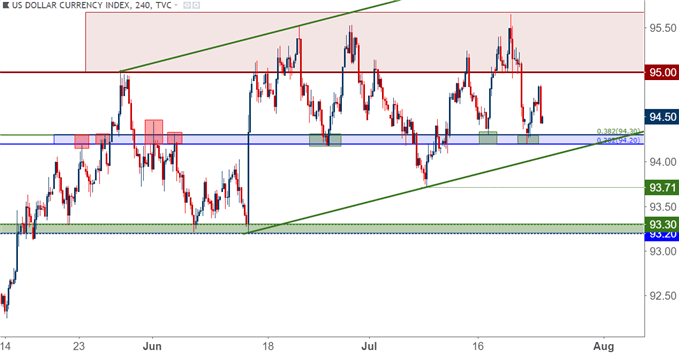
Chart prepared by James Stanley
GBP/USD Bounce From Support: Longer-Term Bearish Trend Offset by Short-Term Strength
We looked into GBP/USD in yesterday’s technical article on the pair entitled, GBP/USD: Cable Correction Continues After 1.3000 Bounce. Next Thursday, August 2nd, brings a ‘Super Thursday’ BoE rate decision, and we were previously looking at fairly strong odds of getting a hike at that rate decision. That enthusiasm has come into question more recently, however, as another disappointing inflation report further muddies the water for the BoE. And if we combine this with the fact that the next few months are full of political uncertainty as we get closer to the EU-UK showdown for Brexit negotiations, and there is even more reason for the Bank of England to remain cautious over their next few rate decisions.
GBP/USD tested a key level last week and bears were unable to substantiate much drive below 1.3000. Since then, we’ve seen a build of bullish short-term price action as we discussed yesterday, and prices are bouncing from support at an area of prior resistance. This can further keep that bearish trend on hold, and this opens the door to possible resistance at previous areas of interest, such as 1.3150 or 1.3200; and if the pullback in USD really becomes pronounced, the 1.3293 swing-high.
GBP/USD Four-Hour Price Chart: Deeper Resistance Potential
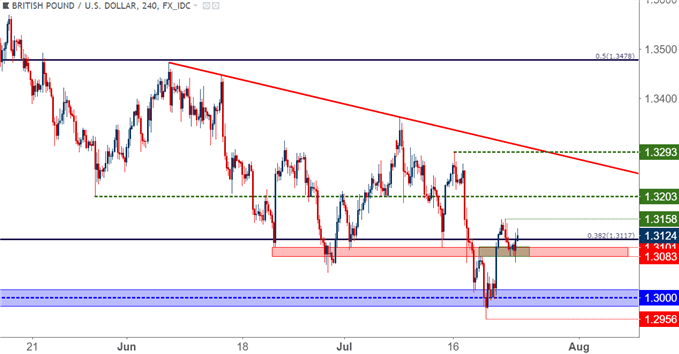
Chart prepared by James Stanley
USD/CAD Attempting to Solidify Higher-Low Support
While the Dollar moves back-and-forth with little long-term direction, there’s a slight bias that’s continuing to show in the currency against the Canadian Dollar. We’d previously looked at support in the pair off the 1.3065 level ahead of the BoC rate decision earlier in the month. And while that did lead to a bullish response, buyers haven’t yet been able to drive back to the June highs in the pair. The support side of the matter remains interesting though, as bulls continue to come-in to support higher-lows in the pair, with last week digging out support above 1.3100 and this week showing more of the same.
This can keep interest around the long side of the pair, particularly for those looking to implement bullish-USD stances.
USD/CAD Four-Hour Price Chart
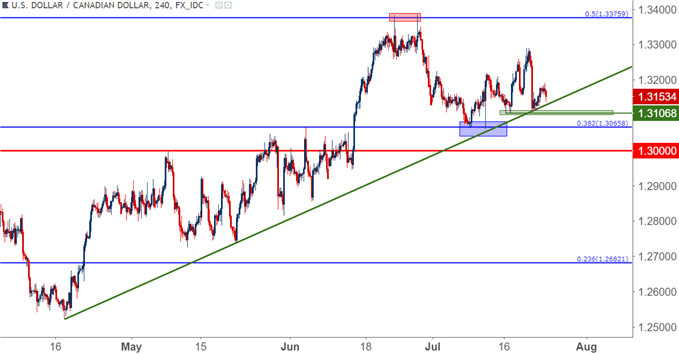
Chart prepared by James Stanley
USD/JPY: Is Change in the Air at the BoJ?
Next week brings a Bank of Japan rate decision, and of recent we’ve seen the growing thought that the bank might start to temper their QE outlay in an initial move towards tapering. A report that was circulated this weekend indicated that the Japanese Central Bank may look to scale back its massive monetary program at this meeting next week. Initially this led to a spike in Japanese yields and Yen strength followed shortly thereafter.
But that report was rebuffed by BoJ Governor, Haruhiko Kuroda, who said he had no idea where the basis for that report came from. Japanese inflation continues to print at very low levels, and there’s a very valid case for expecting the BoJ to continue with stimulus at its current pace.
In the Yen, matters appear less certain. Yesterday’s spike of Yen-strength continued a surge that started last Thursday around President Trump’s comments on the US Dollar. This led to prices testing through short-term support around 111.30 yesterday, and USD/JPY drove all the way down to find support on the projection of a prior resistance trend-line.
USD/JPY Daily Price Chart
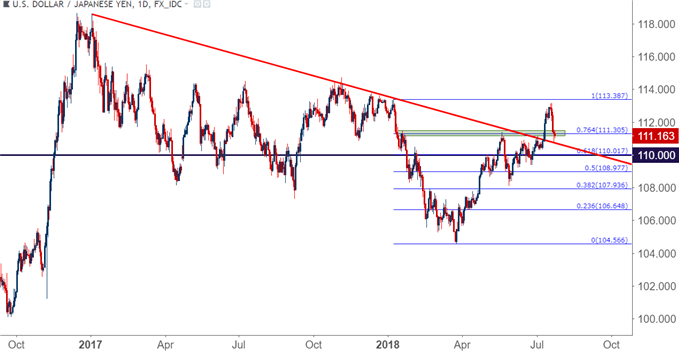
Chart prepared by James Stanley
On a shorter-term basis, we may be seeing the initial stages of a bullish theme in the pair as prices are attempting to set a higher-low. We’re still not out of the woods yet, as all that we have at this point is a lower-high to work with. But – if buyers are able to break back-above 111.54, the door could soon re-open for topside strategies.
USD/JPY Hourly Price Chart
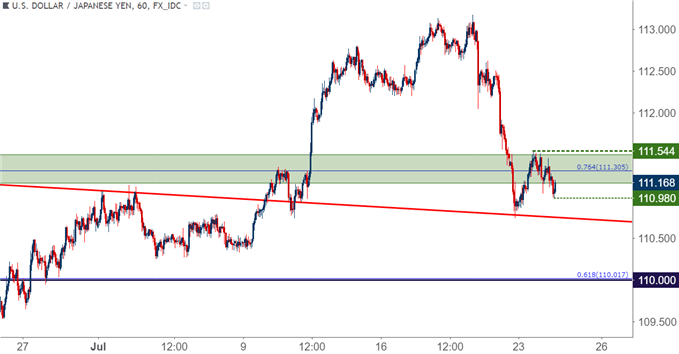
Chart prepared by James Stanley
To read more:
Are you looking for longer-term analysis on the U.S. Dollar? Our DailyFX Forecasts for Q1 have a section for each major currency, and we also offer a plethora of resources on USD-pairs such as EUR/USD, GBP/USD, USD/JPY, AUD/USD. Traders can also stay up with near-term positioning via our IG Client Sentiment Indicator.
Forex Trading Resources
DailyFX offers a plethora of tools, indicators and resources to help traders. For those looking for trading ideas, our IG Client Sentiment shows the positioning of retail traders with actual live trades and positions. Our trading guides bring our DailyFX Quarterly Forecasts and our Top Trading Opportunities; and our real-time news feed has intra-day interactions from the DailyFX team. And if you’re looking for real-time analysis, our DailyFX Webinars offer numerous sessions each week in which you can see how and why we’re looking at what we’re looking at.
If you’re looking for educational information, our New to FX guide is there to help new(er) traders while our Traits of Successful Traders research is built to help sharpen the skill set by focusing on risk and trade management.
--- Written by James Stanley, Strategist for DailyFX.com
Contact and follow James on Twitter: @JStanleyFX


