


Talking Points:
- The US Dollar has continued to drop after Thursday’s reversal from resistance, and prices are already back down to the Fibonacci support zone that had helped to bring out buyers last week. Will this area hold through another test, or will this Dollar pullback driver deeper towards prior July lows?
- The highlight of this week’s FX calendar is the European Central Bank rate decision scheduled for Thursday. This is the first such meeting since the bank’s June announcement of stimulus exit, and this is the first opportunity for the ECB to give some clarity around items such as what they might do with reinvestment of coupons or maturing principal payments, or how the bank might manage interest rate protocol should inflation come-in higher-than-expected.
- DailyFX Forecasts on a variety of currencies such as the US Dollar or the Euro are available from the DailyFX Trading Guides page. If you’re looking to improve your trading approach, check out Traits of Successful Traders. And if you’re looking for an introductory primer to the Forex market, check out our New to FX Guide.
Do you want to see how retail traders are currently trading the US Dollar? Check out our IG Client Sentiment Indicator.
US Dollar Drop Continues Back to Fibonacci Support Zone
The Thursday reversal in the US Dollar has continued into a fresh week, as the bearish move on Friday caught another extension that pushed prices back into a key zone of Fibonacci support. This is around the same area that had come into play last Tuesday morning, helping DXY to catch a bid and run back above the 95.00 level. But, as we’ve seen on three (now four) separate occasions since late-May, bulls were unable to hold the move and prices folded right back towards support.
The big question as we trade into this week is whether buyers will be able to hold the lows, and perhaps more proactively, whether bulls will be able to sustain a topside push beyond that 95.00 level in DXY. We’re now in the midst of Q3 corporate earnings in the US, so that may be able to help; but more likely we’re going to be waiting until the latter portion of the week for any significant USD drivers, as we have trade numbers on Thursday followed by US GDP on Friday.
US Dollar via ‘DXY’ Eight-Hour Price Chart: Another Test of Fibonacci Support 94.20-94.30

Chart prepared by James Stanley
ECB Rate Decision Highlights Back-Loaded Economic Calendar
This week’s FX calendar is rather light, with no high-impact announcements on the blotter until we get to tomorrow night’s release of Australian CPI. We then have to wait until Thursday morning for the next high-impact event, and that’s the European Central Bank’s July rate decision along with the accompanying press conference. Out of the US, we get trade numbers on Thursday followed by Q2 GDP numbers on Friday morning.
DailyFX Economic Calendar: High-Impact Events, Week of July 23, 2018

Chart prepared by James Stanley
US Dollar’s Q3 Indecision Continues
The Dollar came into Q3 with a full head of steam after the bullish reversal that showed up last quarter. But so far, July hasn’t been so friendly to the Greenback as the currency has struggled to maintain any lasting gains. At this stage, we’re actually below the price in which DXY had opened Q3, and much of the period has seen the same.
Last week helped to bring a fresh yearly high into DXY, but that was promptly reversed around President Trump’s comments that started to show up on Thursday afternoon. We’ve seen that reversal continue back-down to this key area of support, and the big question here is whether it’ll hold up through another test. If it doesn’t, there are a couple of areas of interest just underneath current price action. Projecting at around 94.00 we have the bullish trend-line that can be found by connecting the June and July swing lows. A bit deeper, running from 93.20-93.20 we have the June swing lows. And if we break below that area, bulls will likely want to question their stance, at least in the near-term, as we’d have a series of bearish items to investigate regarding near-term price action.
US Dollar Daily Price Chart: Unable to Sustain Beyond 95.00, Almost Two Months of Indecision

Chart prepared by James Stanley
EUR/USD Tests Resistance Ahead of ECB
The ECB is the highlight of this week’s economic calendar, and this is the first time that we’ll hear from the bank at a rate decision and press conference since the June announcement of stimulus-taper. At this stage, the bar for rate hikes out of the ECB is extremely low as the bank said that they’re anticipating keeping rates at current levels at least through the summer of next year. Just after that announcement, we saw inflation come in at a one-year high of 1.9%, just under the ECB’s 2% target, and already we started to see rate hike bets get pushed up a bit, helping EUR/USD to recover back-above the key zone of 1.1685-1.1736.
But, as we traded deeper into July, data did not keep up that positive tone and sellers soon came back to push EUR/USD down. At this stage, EUR/USD is holding resistance in that key area on the chart, with the price of 1.1736 helping to cap this current advance. The price of 1.1736 is the 38.2% Fibonacci retracement of the 2014-2017 major move in EUR/USD.
EUR/USD Eight-Hour Price Chart: At Resistance, Driving Deeper Within Symmetrical Wedge
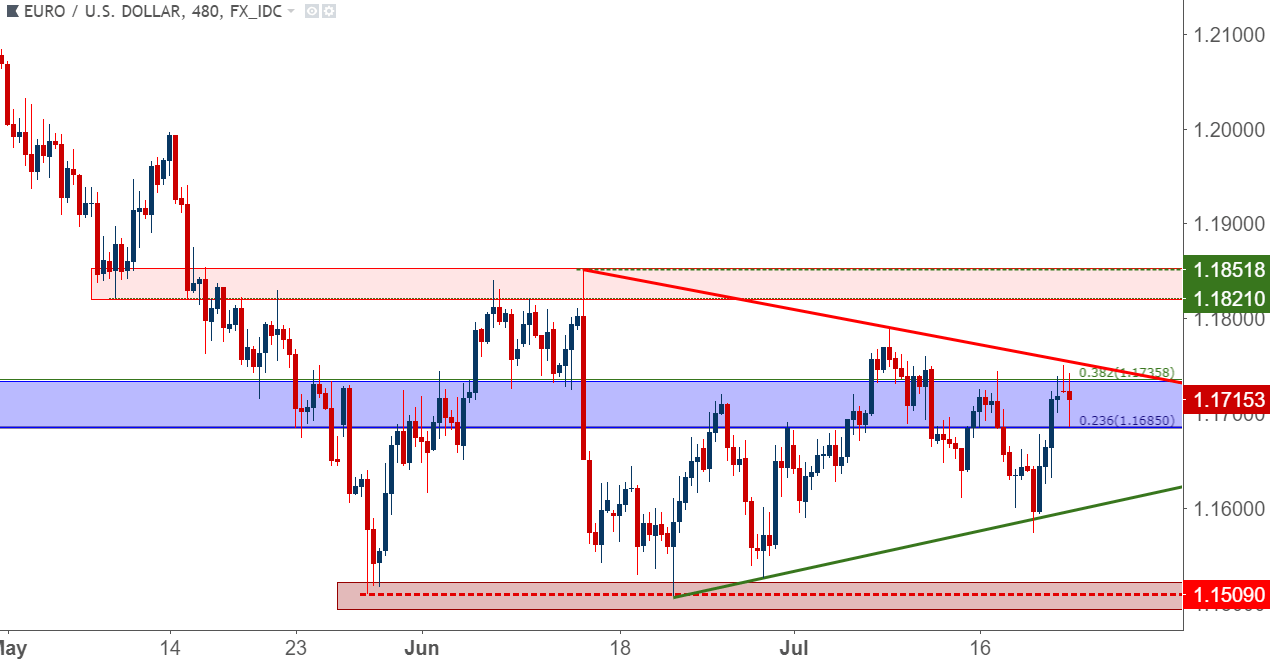
Chart prepared by James Stanley
This helps to keep the pair in a symmetrical wedge formation that’s now been building for the entirety of Q3. This would allude to the fact that a breakout is nearing but, unfortunately, given the symmetrical nature of the setup there would not yet be a prevailing bias that could be anticipated.
EUR/USD Daily Price Chart: Building Breakout Potential After Digestion of Q2 Move
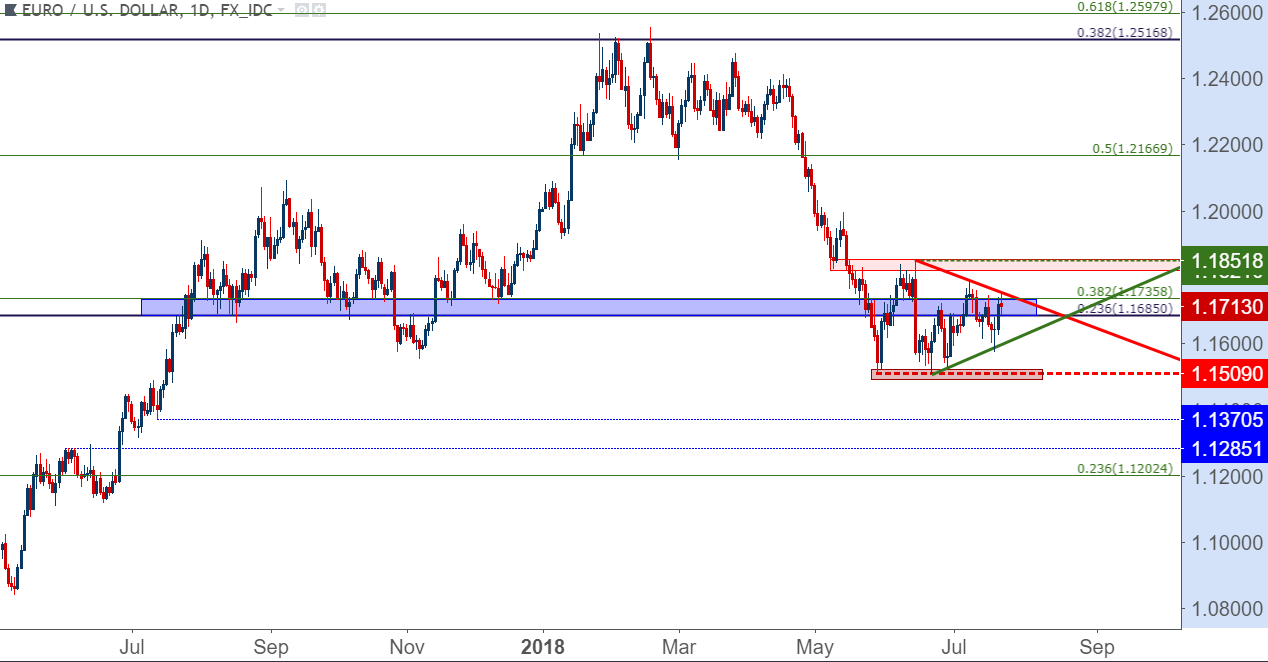
Chart prepared by James Stanley
To read more:
Are you looking for longer-term analysis on the U.S. Dollar? Our DailyFX Forecasts for Q1 have a section for each major currency, and we also offer a plethora of resources on USD-pairs such as EUR/USD, GBP/USD, USD/JPY, AUD/USD. Traders can also stay up with near-term positioning via our IG Client Sentiment Indicator.
Forex Trading Resources
DailyFX offers a plethora of tools, indicators and resources to help traders. For those looking for trading ideas, our IG Client Sentiment shows the positioning of retail traders with actual live trades and positions. Our trading guides bring our DailyFX Quarterly Forecasts and our Top Trading Opportunities; and our real-time news feed has intra-day interactions from the DailyFX team. And if you’re looking for real-time analysis, our DailyFX Webinars offer numerous sessions each week in which you can see how and why we’re looking at what we’re looking at.
If you’re looking for educational information, our New to FX guide is there to help new(er) traders while our Traits of Successful Traders research is built to help sharpen the skill set by focusing on risk and trade management.
--- Written by James Stanley, Strategist for DailyFX.com
Contact and follow James on Twitter: @JStanleyFX


