


Talking Points:
- The British Pound recovered in the latter-portion of last week after failing to drive through the 1.3000 level. That was the first test of the key psychological level since last year, and retail traders have been suspiciously bearish around the move, highlighting the potential for a deeper retracement before the longer-term bearish trend might be ready for continuation.
- This week is light on data for the UK, but next week brings the August ‘Super Thursday’ rate decision out of the Bank of England. The prospect of a rate hike at this meeting had previously helped to support the bid in the British Pound, but that theme has fallen-back after last week’s release of June inflation data, showing a third consecutive month at 2.4%. Will the BoE hike to push inflation back to their 2% target? Or are we headed for another passive outlay from the Bank of England as political pressure heats up as we near the EU-UK showdown for Brexit negotiations, scheduled for just a few months away from now.
- Quarterly Forecasts have just been updated, and the Q3 forecast for GBP/USD is available from the DailyFX Trading Guides Page. If you’re looking to improve your trading approach, check out Traits of Successful Traders. And if you’re looking for an introductory primer to the Forex market, check out our New to FX Guide.
Want to see how retail traders are currently trading GBP/USD? Click here for GBP/USD Sentiment.
GBP/USD: The Cable Correction Continues
The latter-portion of last week saw a strong bounce develop in GBP/USD, and this came after the pair tested below a key psychological level for the first time since last September. As we wrote earlier during the week, the down-trend in the British Pound was very much in-focus as we approached a read of inflation out of the UK for the month of June. Markets were looking for inflation to perk-up to 2.6% after two consecutive months at 2.4%, but the actual print gave us a third straight month at 2.4% to further muddy the water for the Bank of England. The BoE is nearing a ‘Super Thursday’ rate decision in just a week and a half, and the growing thought was that we may see a rate hike at that meeting. This was supported by the three dissenting votes at the last rate decision in June, and that was coupled with the prospect of stronger rates of inflation pushing the bank into a more-hawkish stance.
But that inflation strength is no longer as prominent, and in the wake of last week’s inflation report, prices dipped below the 1.3000 level for the first time since last year. But – as we wrote shortly after, GBP/USD was still very oversold. We looked for two areas of potential resistance may that could’ve opened the door for bearish strategies. But – no resistance showed at either, and prices are now finding a bit of support on the zone that we were looking at that runs from 1.3083-1.3100.
GBP/USD Four-Hour Price Chart: Bounce Seeking Out Higher-Low Support Around Prior Resistance
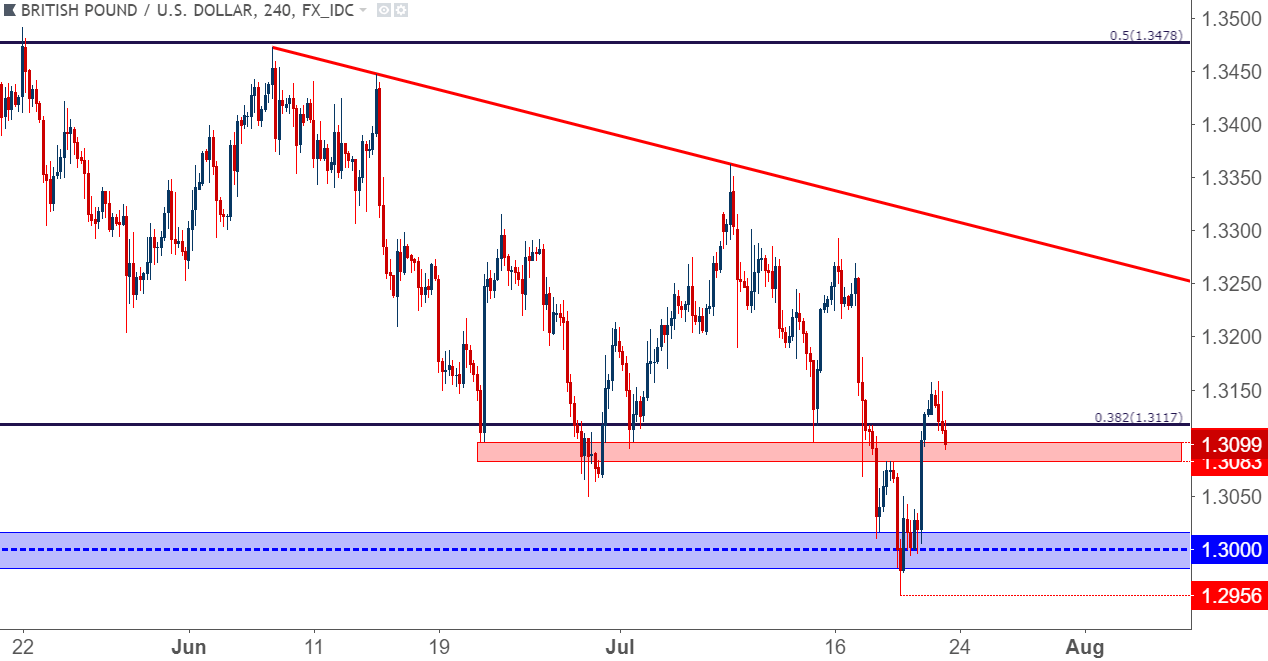
Chart prepared by James Stanley
A Light Week of Data Ahead of the August ‘Super Thursday’ BoE Meeting
This week brings little data to the table out of the UK economy, as we have but two medium-impact announcements on the calendar for this week. Next week will likely be a much bigger deal with that BoE Super Thursday event on Thursday, August the 2nd, but traders are getting little data to work with as we near that announcement. This can help to further keep the focus on charts as traders position for that next rate decision.
DailyFX Economic Calendar: GBP-Related Events for Week of July 23, 2018
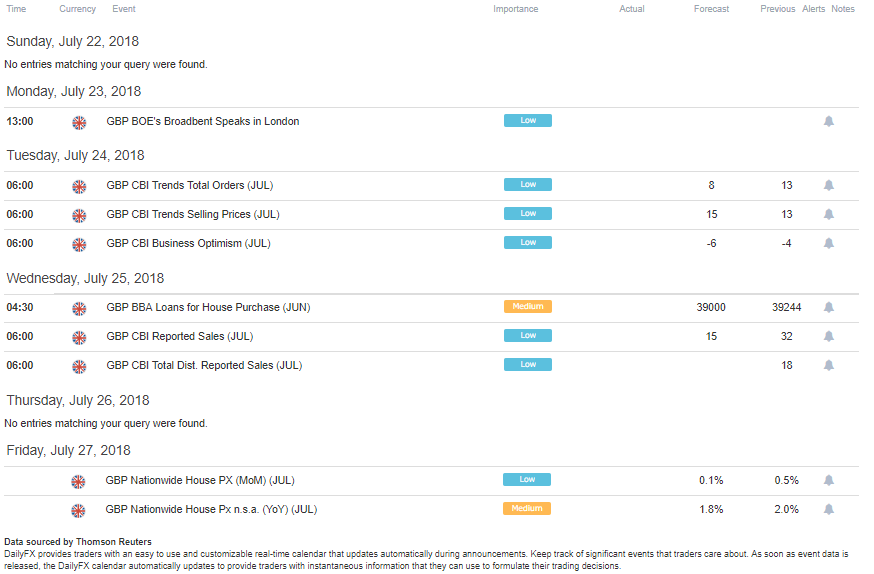
Chart prepared by James Stanley
Retail Continues to Get ‘Less Long,’ Pointing to Deeper Retracement Potential
In our last article, we pointed out the changes to retail sentiment in GBP/USD after last week’s test of 1.3000. IG Client Sentiment is traditionally looked at as a contrarian indicator, with a net long read on the retail side being seen as a bearish indicator. But – as we noted, it was the change in retail sentiment that was really interesting last week, as that test of key 1.3000 support saw retail traders get less long on the move.
That theme has continued, and retail sentiment in GBP/USD is currently showing at 1.79-to-1, or 1.79 retail traders are long for every one that is short. This is down from last Thursday’s elevated read 2.82-to-1, and that was down from Wednesday’s read of 2.91-to-1.
Another way of putting this is that recent retail activity has been growing increasingly bearish, and given the contrarian nature of retail sentiment, this can keep the door open for a larger retracement as prices further recover from the failed test to break-through 1.3000.
IG Client Sentiment in GBP/USD
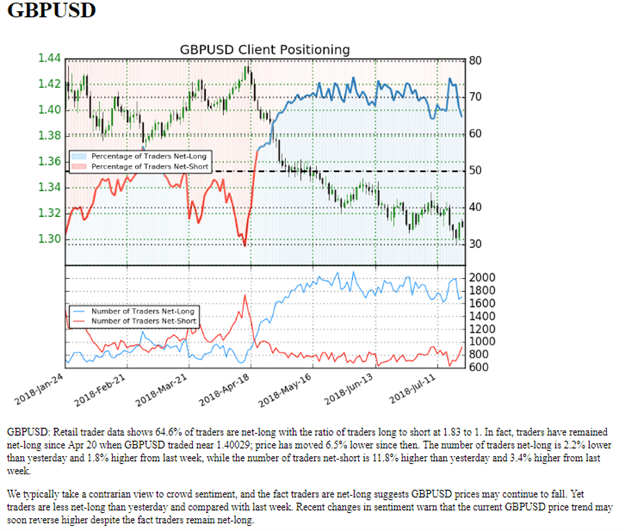
Chart prepared by James Stanley
GBP/USD Strategy
At this point, the bigger-picture trend in GBP/USD price action remains bearish. But – we’re still rather far away from any recent swing-highs, and substantiating that short-side stance could be difficult at the moment. RSI on the daily chart has continued to diverge from recent price action, and this is yet another factor that can keep the bearish approach at bay, at least for now.
GBP/USD Daily Price Chart: RSI Divergence
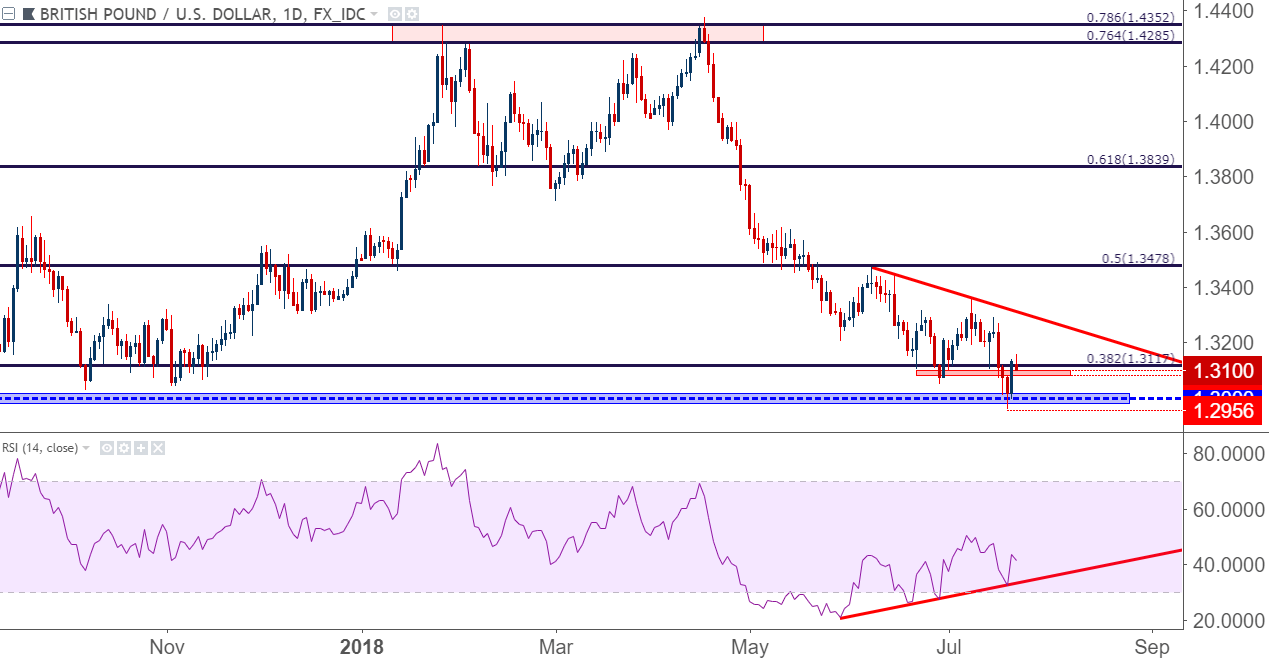
Chart prepared by James Stanley
On a shorter-term basis, there may soon be a possible bullish scenario to work with. Last week’s push above Fibonacci resistance at 1.3117 helped to bring on a short-term higher-high, and prices are now pulling back into the area we’d looked at for potential resistance. If we do see support come-in at-or-around the 1.3083 area, then we’d have a shorter-term higher-low to go along with that higher-high, and traders could look into topside stances at that point. On the target side of the setup, traders could look for a move back to 1.3200.
GBP/USD Hourly Price Chart: Higher-Low Support Hold at Prior Resistance Keeps Door Open for Longs
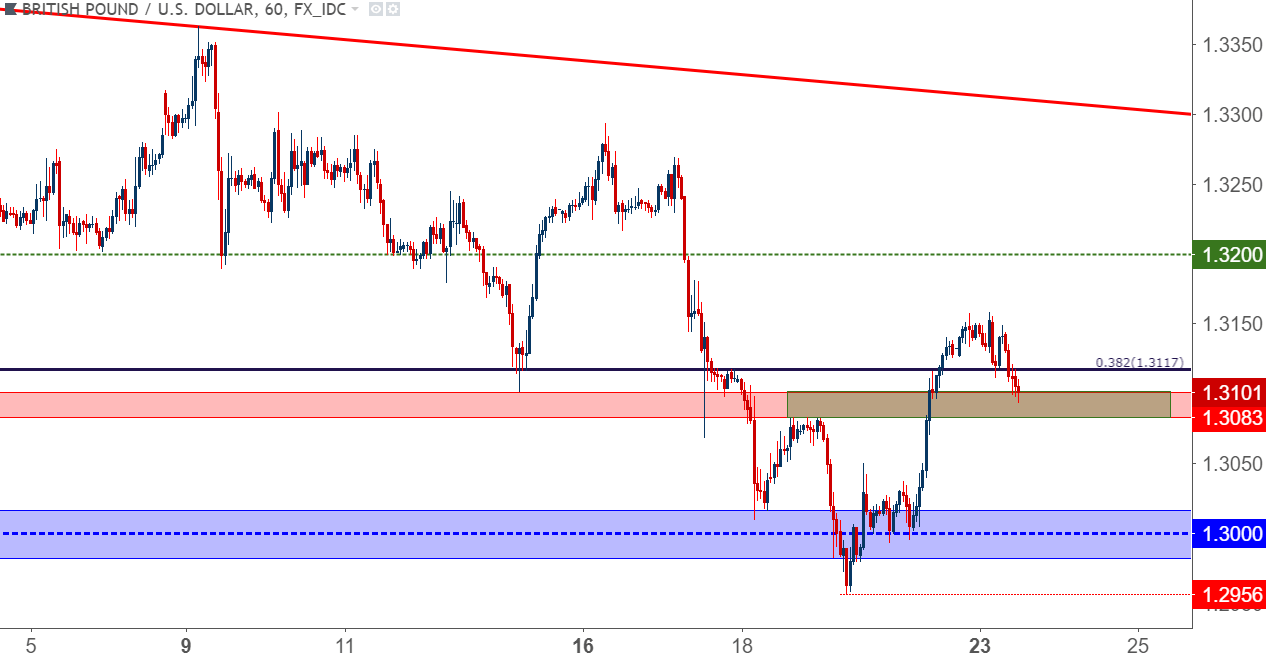
Chart prepared by James Stanley
To read more:
Are you looking for longer-term analysis on the U.S. Dollar? Our DailyFX Forecasts for Q1 have a section for each major currency, and we also offer a plethora of resources on USD-pairs such as EUR/USD, GBP/USD, USD/JPY, AUD/USD. Traders can also stay up with near-term positioning via our IG Client Sentiment Indicator.
Forex Trading Resources
DailyFX offers a plethora of tools, indicators and resources to help traders. For those looking for trading ideas, our IG Client Sentiment shows the positioning of retail traders with actual live trades and positions. Our trading guides bring our DailyFX Quarterly Forecasts and our Top Trading Opportunities; and our real-time news feed has intra-day interactions from the DailyFX team. And if you’re looking for real-time analysis, our DailyFX Webinars offer numerous sessions each week in which you can see how and why we’re looking at what we’re looking at.
If you’re looking for educational information, our New to FX guide is there to help new(er) traders while our Traits of Successful Traders research is built to help sharpen the skill set by focusing on risk and trade management.
--- Written by James Stanley, Strategist for DailyFX.com
Contact and follow James on Twitter: @JStanleyFX


