


Talking Points:
- The Dow looks set to gap-lower this morning as US Dollar strength continues. The weekend-gap that we looked at yesterday in the Dow has now been filled, and we’re now testing an area of support that held-up the lows throughout last week.
- Elsewhere – support has not been so friendly. The Euro is digging deeper into the zone that helped to hold the lows for the latter-portion of last year, and GBP/USD has been in hard-sell mode as another disappointing release of UK inflation numbers make the prospect of tighter policy from the BoE even more distant.
- DailyFX Forecasts have been updated for Q2, and are available from the DailyFX Trading Guides page. If you’re looking to improve your trading approach, check out Traits of Successful Traders. And if you’re looking for an introductory primer to the Forex market, check out our New to FX Guide.
Do you want to see how retail traders are currently trading the US Dollar? Check out our IG Client Sentiment Indicator.
Dollar Rallies Back to Resistance While US Equities Reverse Early-Week Breakout
The US Dollar is back to the 94.00 level on DXY, and this is the same area that had helped to turn-around prices shortly after this week’s open. Given the scope of the trend in USD over the past month, continuation of that bullish move comes as no small surprise, but what has been a bit more noticeable over the past 24 hours has been a re-emergence of sellers in US Stocks. US Equities opened the week with a bang, gapping-higher with the Dow crossing the vaulted 25,000 marker. But – as we wrote yesterday, there was unfilled gap from that weekend jump, and this kept the door open for bearish reversal setups in the Dow.
US equities showed mild bearish behavior around yesterday’s US open, but that started to heat up throughout the session. That theme of equity weakness continued in Futures markets after the US close, and as we approach this morning’s US open, that gap has been filled and prices are now finding support at the same 24,630 area that was in-play for much of last week.
Dow Jones Hourly Chart: Gap Fills and Prices Run Down to Prior Support
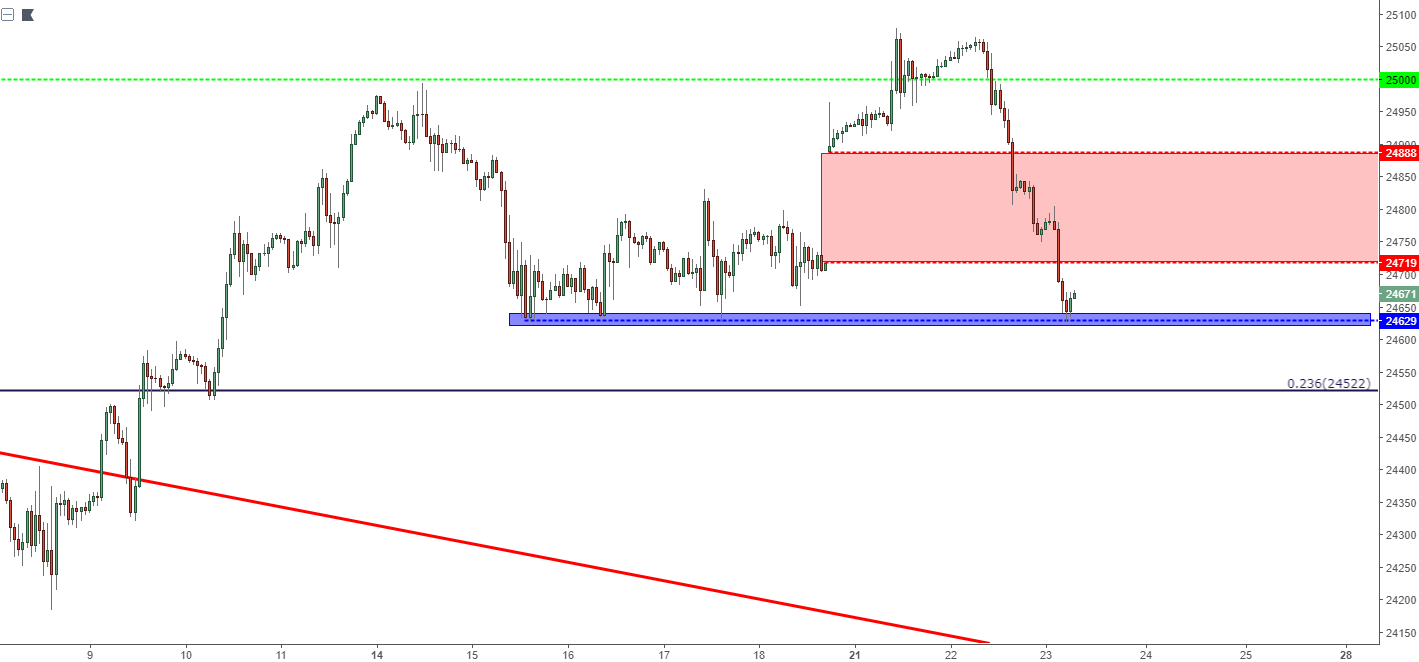
Chart prepared by James Stanley
US Dollar Back to Highs
This turn-lower in stocks has happened as another round of USD-strength showed-up. The US Dollar is back towards the 2018 highs that were set on Monday before a retracement came-in, and this keeps the door open to topside continuation up to the confluent zone that runs from 94.19 up to 94.30 on DXY.
US Dollar via ‘DXY’ Daily Chart: Prices Approaching Confluent Resistance 94.19-94.30
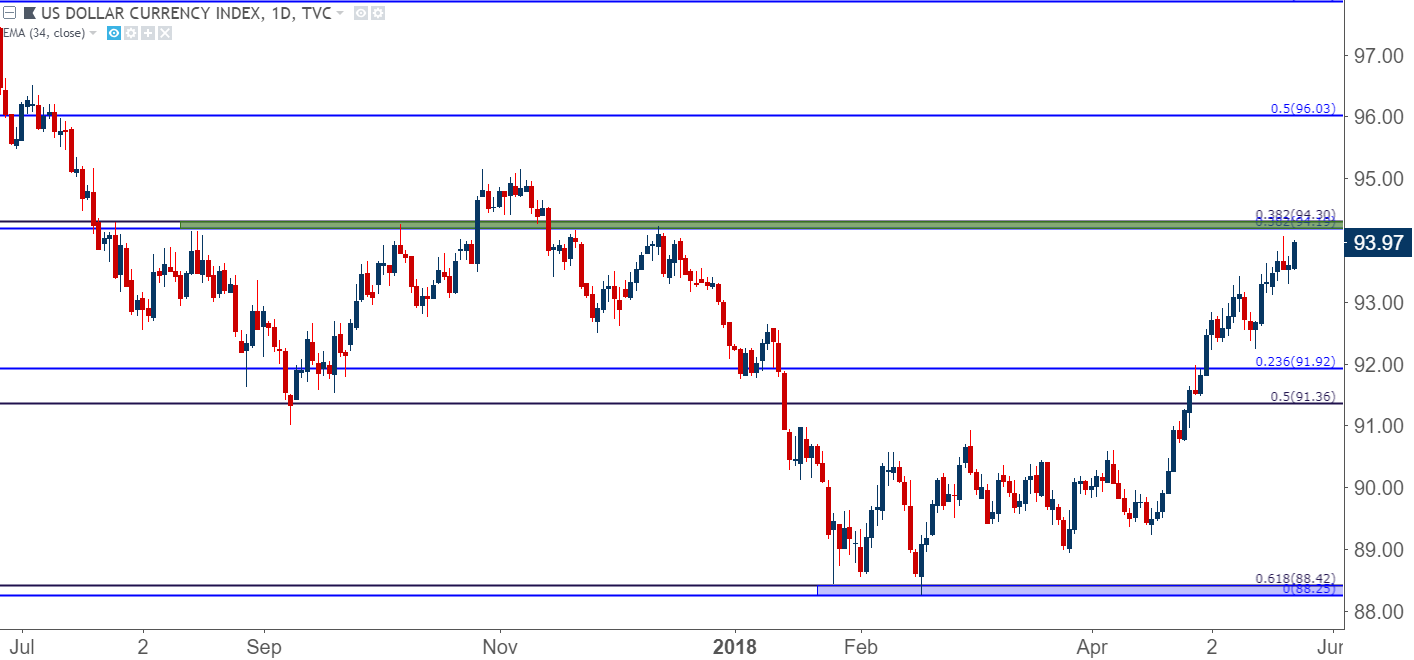
Chart prepared by James Stanley
Cable Crushed After Another Inflation Miss in the UK
The up-trend in the US Dollar got started last month around the print of UK inflation. Expectations were high that inflation strength in the UK would drive the BoE towards more rate hikes; with markets very much primed for an adjustment at this month’s rate decision. But as that inflation came-out in a disappointing manner, those rate hike bets started to get kicked out in the future, and GBP/USD started to slide. A bad GDP report released shortly after only added fuel to the fire, and when we did finally get to that Bank of England rate decision, the BoE took a very dovish outlook to markets and this helped to drive the pair deeper into an area of long-term support around 1.3500.
As we opened this week, that support finally gave way, and the driver here had little to do with inflation or the Bank of England, as this came from a surprise announcement by Scottish PM Nicola Sturgeon around the prospect of another campaign for Scottish independence; producing yet another twist in the saga of Brexit. At that point, we began lining up short-side setups, based off of resistance showing at that prior area of key support in GBP/USD.
This morning produced another leg of weakness in the move, as yet another disappointing inflation report is keeping bears active; as the BoE has even less reason to look at near-term rate hikes as prices continue to grow in a slower manner in the British economy.
UK Headline CPI Continues to Soften

Chart prepared by James Stanley
GBP/USD price action continues in a nasty manner. We looked into this setup in-depth in yesterday’s webinar, and the resistance that we were following around prior support legged-in to a big move of weakness in the pair. Prices are now at fresh 2018 lows, breaking below the bear flag formation that had started to show. This keeps the door open for further losses in GBP, and as we looked at yesterday, GBP/USD remains one of the more attractive venues to play a continuation of US Dollar strength.
GBP/USD Hourly Chart: Breakdown to Fresh Lows After Resistance at Prior Support
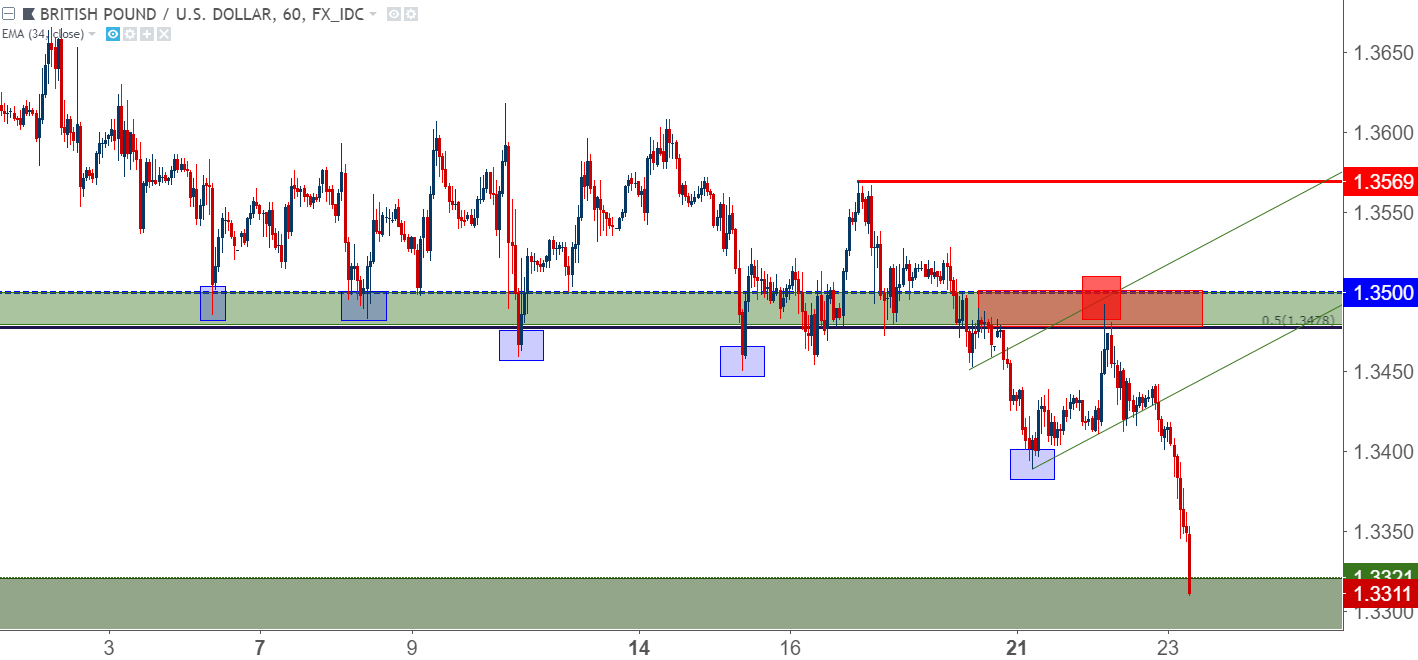
Chart prepared by James Stanley
On a longer-term basis, GBP/USD is testing an area of prices that was relevant in the second half of last year. This is the subordinated support zone that we looked at on Monday, and at this point, prices are beginning to test the top-end of this area. This zone runs from 1.3270 up to 1.3321, and after a quick swing-high in August of last year, followed by a few other instances of resistance, this zone became support in mid-December before the pair launched up to fresh post-Brexit highs. Now that we’re back down here – might it be able to help stem the flow of selling pressure?
GBP/USD Daily Chart:
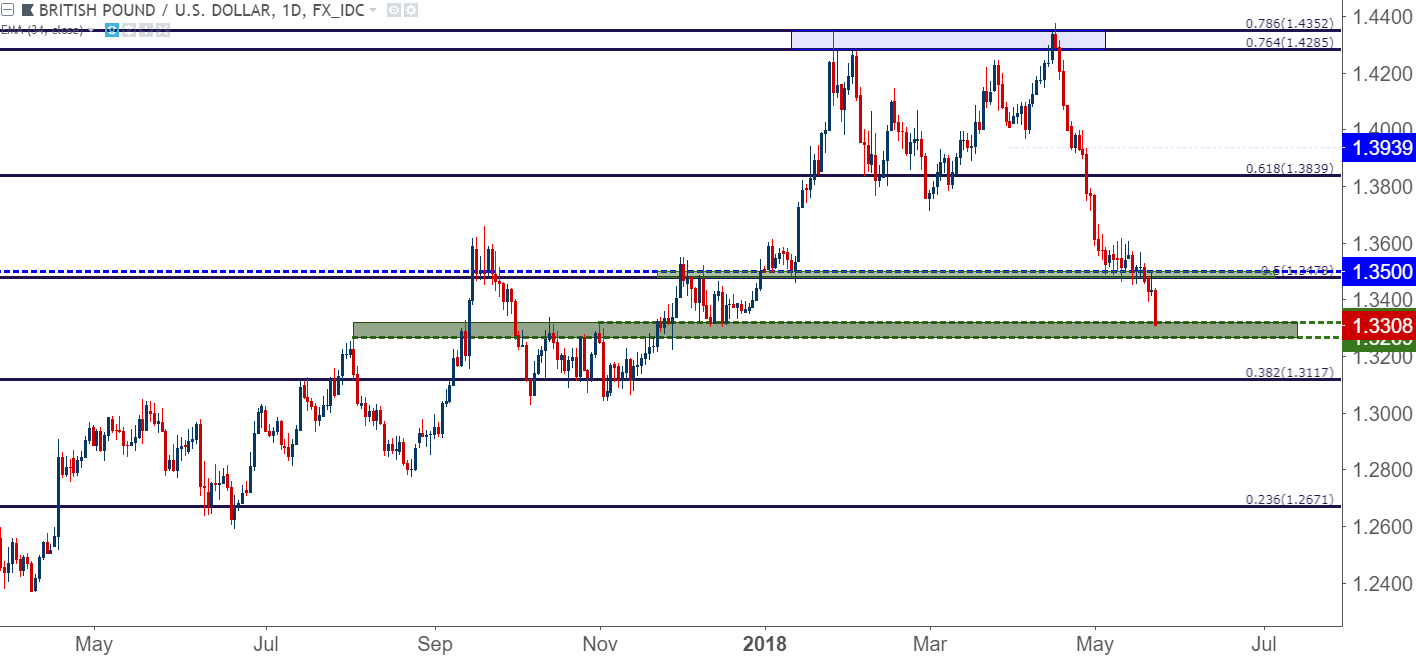
Chart prepared by James Stanley
Euro to Fresh Lows as Italian Politics Move Further into the Spotlight
The bullish run in EUR/USD last year kicked-off after the resolution of the first round of French elections. At the time, there was a deep concern for the state of the Euro-Zone, as we had the prospect of a French election between a far-right and a far-left candidate. But when that resolved with Emmanuel Macron taking on Marine Le Pen, Euro-markets gapped-higher and never really looked back.
Markets are starting to look back now. In Italy, the Five-Star movement, often considered to be ‘anti-establishment,’ looks to be close to installing a political newcomer to the PM spot for the country. One popular US-based cable news outlet summarized the matter as: “Italy is set to create its most anti-establishment government since the end of fascism in 1945.”
This carries with it the potential for fireworks in the bloc, as there have already been reports that the new government is considering Italy’s potential exit from the Euro-Zone. This could bring along a potential move away from the Euro as the country’s currency, thereby delivering another blow to the drive of European unification that hit a major stumbling block in June of 2016.
At this point, EUR/USD is testing deeper into the support zone that we looked at yesterday after having set a fresh 2018 low earlier this morning.
EUR/USD Daily Chart: Prices Test Deeper into Support Zone 1.1685-1.1736

Chart prepared by James Stanley
While this support was rather rigid last year, traders may want to be careful of playing bullish reversals here. This political backdrop could have the ammunition to produce panic-like moves, especially after the past couple weeks of price action. If support doesn’t hold at 1.1685, the door is open for deeper moves towards longer-term supports at 1.1500 and then 1.1250.
EUR/USD Four-Hour Chart: Bearish Continuation Prospects as Sellers Remain in-Control

Chart prepared by James Stanley
To read more:
Are you looking for longer-term analysis on the U.S. Dollar? Our DailyFX Forecasts for Q1 have a section for each major currency, and we also offer a plethora of resources on USD-pairs such as EUR/USD, GBP/USD, USD/JPY, AUD/USD. Traders can also stay up with near-term positioning via our IG Client Sentiment Indicator.
Forex Trading Resources
DailyFX offers a plethora of tools, indicators and resources to help traders. For those looking for trading ideas, our IG Client Sentiment shows the positioning of retail traders with actual live trades and positions. Our trading guides bring our DailyFX Quarterly Forecasts and our Top Trading Opportunities; and our real-time news feed has intra-day interactions from the DailyFX team. And if you’re looking for real-time analysis, our DailyFX Webinars offer numerous sessions each week in which you can see how and why we’re looking at what we’re looking at.
If you’re looking for educational information, our New to FX guide is there to help new(er) traders while our Traits of Successful Traders research is built to help sharpen the skill set by focusing on risk and trade management.
--- Written by James Stanley, Strategist for DailyFX.com
Contact and follow James on Twitter: @JStanleyFX


