


Talking Points:
- This week’s economic calendar is relatively tame compared to the past couple of weeks; but coming more into focus is next week’s FOMC rate decision, which is currently showing an 88.8% chance of a hike. This will be Jerome Powell’s first rate decision as the head of the bank, and this is an opportune time to get a feel for how Mr. Powell’s tenure atop the bank might take place.
- Before we get to next week’s widely-expected rate hike, we get inflation data out of the United States tomorrow morning, and this has been a hot-button around US Dollar price action. The Greenback is currently seeing range expansion ahead of the next two weeks’ outlay, and this has helped to craft a support test in EUR/USD while GBP/USD is testing shorter-term resistance. Also of interest is a longer-term setup in USD/JPY, which has provided enough support to quell the shorter-term sell-off, creating a second shorter-term symmetrical wedge formation.
If you’re looking for longer-term analysis on US Stocks, the Euro or the U.S. Dollar, click here for our Trading Guides.
US Inflation Data This Week – FOMC Next Week
The next couple of weeks are lining up to be quite interesting for the US Dollar, particularly after last week’s robust NFP print. Non-Farm Payrolls blew through the expectation of +205k to print at +313k; but lagging Average Hourly Earnings was a bit of a hindrance and the net price action result was a spinning top formation for Friday in DXY. A spinning top is similar to a Doji in the fact that they’re both ‘indecision’ indicators, but the spinning top has a slightly wider body than what might show up in a Doji.
US Dollar Price Chart via ‘DXY’: Daily Time-Frame, Friday NFP Produces Spinning Top, 90.00 Support
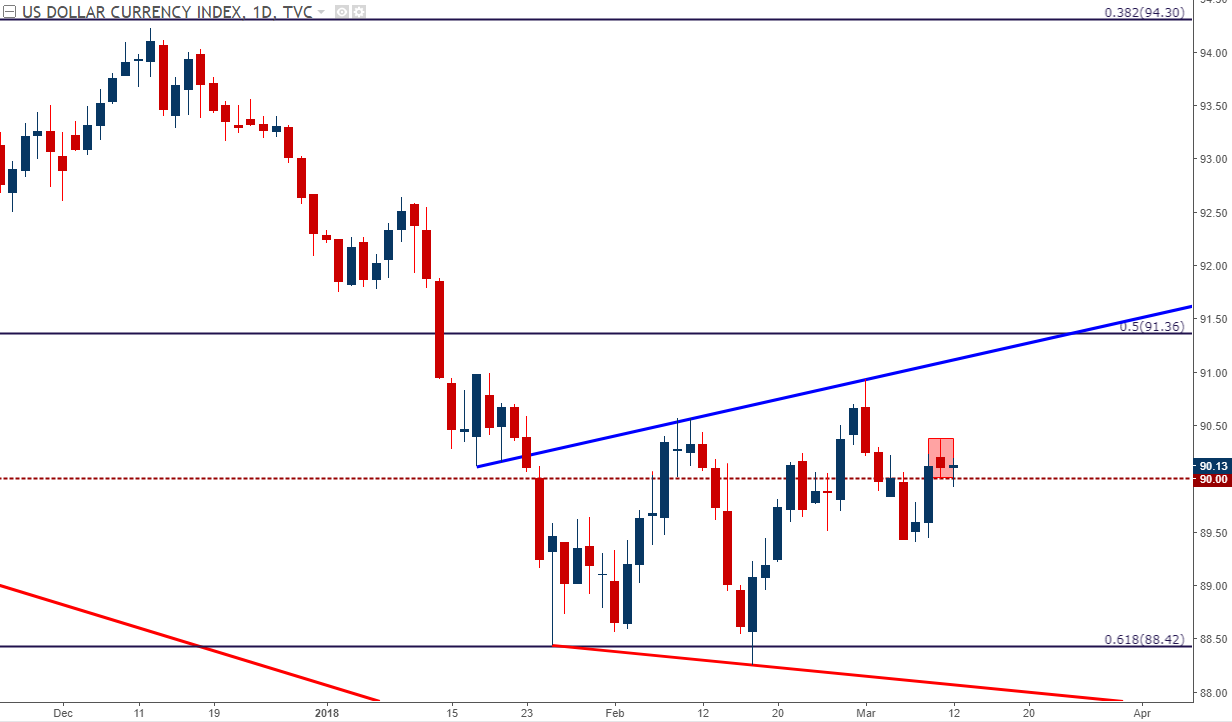
Chart prepared by James Stanley
The price action that we saw last week around NFP helps to show how important inflation data is in the current context. Even a blowout on the headline number couldn’t elicit any significant strength in the Greenback, and the likely reason why is the buffer of that lagging AHE. Speaking to this theme, February saw a slight beat on the headline, +200k v/s an expectation of +180k, but the US Dollar struck a spate of strength that lasted for about a week; largely on the basis of a surprisingly strong Average Hourly Earnings print in that report. That number originally came-in at 2.9%, but was revised down to 2.8% on Friday. February Average Hourly Earnings disappointed by coming-in at 2.6% versus the expectation of 2.8%.
This is key because on next week’s calendar is the Federal Reserve at a rate decisions that’s widely-expected to bring a hike. Probabilities are currently at 88.8% for a rate hike next Wednesday via CME Fedwatch. Before we get to that rate decision, we have US CPI data on the docket for tomorrow; and this should make for an interesting backdrop for USD price action as we get closer to that next rate adjustment out of the FOMC.
US Dollar Price Chart via ‘DXY’: Four-Hour Time-Frame, Expanding Range as FOMC Nears
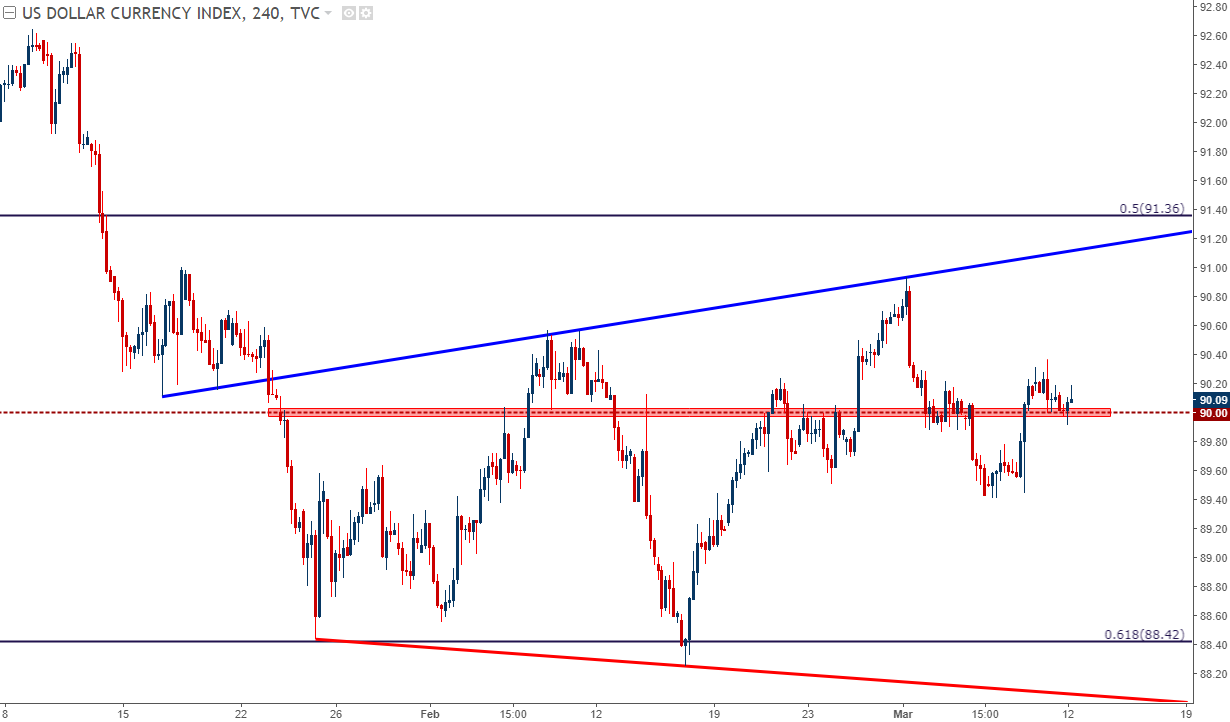
Chart prepared by James Stanley
EUR/USD Bounces Around Prior Support/Resistance Levels
That surging up-trend in the Euro that played-out through January continues to rest after another failed attempt to take-out the 1.2500 psychological level. Last week, prices couldn’t even get-up to 1.2500 as sellers came in about 50 pips early to help punch prices back down to prior support. On Friday, we looked at a support level from January/February around 1.2281; and that price helped to perch EUR/USD up to another previous support level around 1.2335. Sellers have come back on the early part of the morning, giving the appearance that a deeper move may be in the cards. The prices of 1.2213 and 1.2167 become interesting for next supports, and this can be used for short-side profit targets or potential jumping-off points for longer-term bullish strategies. The support structure from February continues to show reactions, and these levels can remain usable until invalidated by fresh highs or lows.
EUR/USD Price Chart: Four-Hour Time-Frame, January/February Support Structure Holding
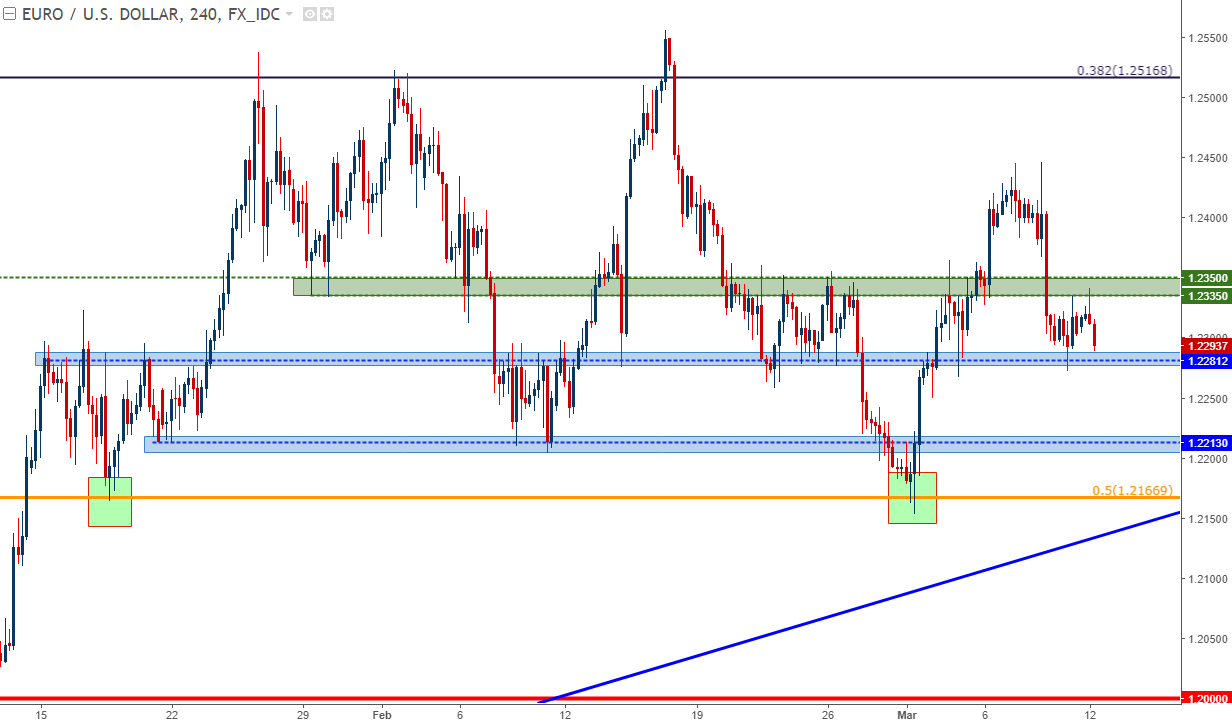
Chart prepared by James Stanley
The longer-term bullish trend remains, but prices may have a deeper dive in store before that bigger-picture up-trend is ready for resumption.
EUR/USD Price Chart: Daily Time-Frame, Longer-Term Confluence of Support

Chart prepared by James Stanley
GBP/USD
Cable is in a similar spot as EUR/USD, albeit with different timing. That longer-term bullish up-trend remains in-order in GBP/USD, but rather than having a range-bound environment over the past couple of months, GBP/USD has been putting in lower-lows and lower-highs, as governed by this descending trend-line on the four-hour chart.
GBP/USD Price Chart: Four-Hour Time-Frame, Descending Trend-Line
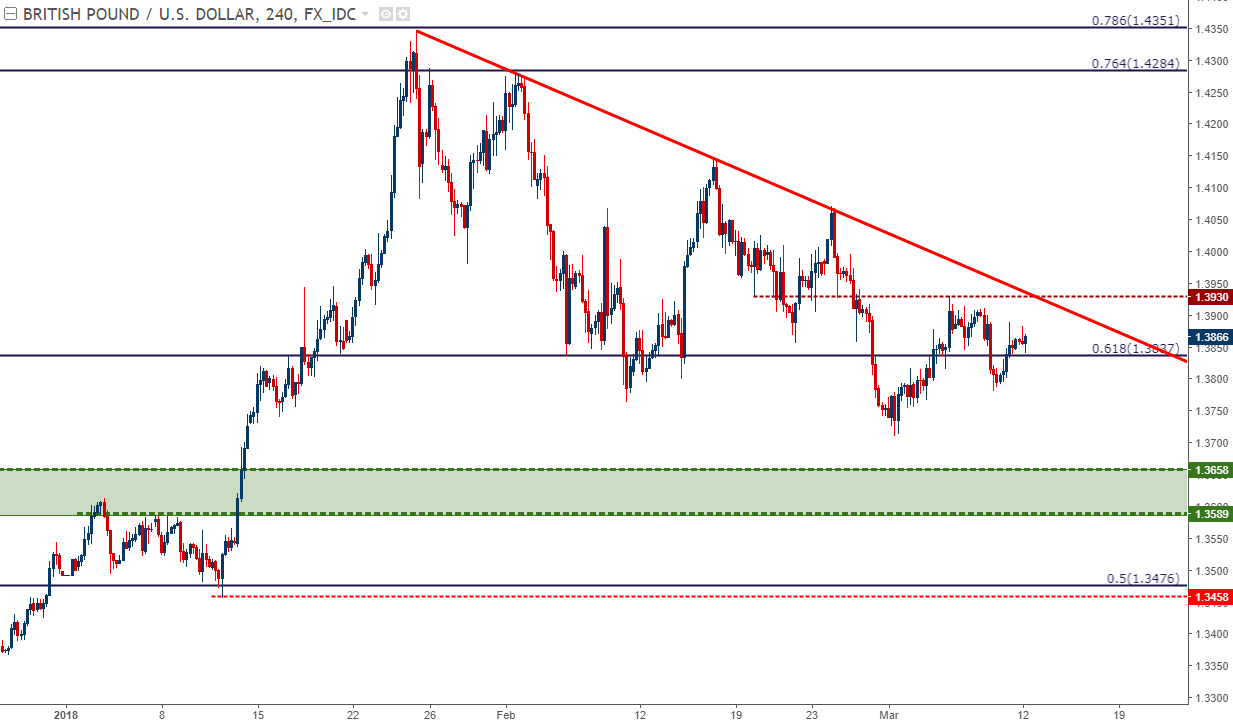
Chart prepared by James Stanley
Last week’s swing-high at 1.3930 can be useable for short-term bearish approaches; as lower-high resistance below this level keeps the door open for short-side setups with eyes on re-tests of prior lows towards 1.3700.
On a longer-term basis, there are two areas of interest for bigger-picture support. We’ve been following one zone that comprises a group of swing highs from Q4 of last year, and this runs from 1.3589-1.3658. Below that, around the 1.3500 psychological level, is a Fibonacci level at 1.3478, and this support has already come into play in 2018, helping to set a swing-low in early January before the pair rocketed-up to fresh post-Brexit highs.
GBP/USD Price Chart: Daily Time-Frame, Deeper Support Potential

Chart prepared by James Stanley
USD/JPY Testing Long-Term Support
We’ve been following USD/JPY’s support test over the past few weeks, as the support side of a symmetrical wedge started to come into play in February and, since then, the lows have largely been contained. That support has been aided in-part by a Fibonacci retracement, the 23.6% level of the 2015-2016 major move. A break-below that Fibonacci level exposes the four-year low in the pair for a re-test around the 99.00 level.
USD/JPY Price Chart: Weekly Time-Frame, Long-Term Support Test

Chart prepared by James Stanley
Since that Fibonacci support came into play earlier in March, near-term price action has been congesting, creating another shorter-term symmetrical wedge. This shorter-term wedge is shown below in red, with the support level from the previous wedge represented in blue. This can keep the door open for short-side strategies targeting re-tests of prior lows and, if we do get that support break in the longer-term setup, the door could open for considerably more down-side towards that 99.00/100.00 level.
USD/JPY Price Chart: Four-Hour Time-Frame, Wedge within Longer-Term Formation

Chart prepared by James Stanley
To Avoid the US Dollar: EUR/JPY
We can combine some of the above themes in the effort of avoiding a US Dollar that, frankly, has quite a bit going on at the moment. Not only do we have this week’s inflation followed by next week’s Fed; but the Dollar is in the midst of an expanding range, which will often show-up in front of a big move, in one direction or the other.
For those looking to work with Euro weakness and Yen strength, EUR/JPY could be an attractive candidate, and price action in the pair is showing the build of bearish structure that could be leading into a directional move. The prior price of 132.05 helped to set support for the final three-and-a-half months of 2017. As the pair continued to show strength in January, a reversal in February saw this price find a series of support tests before finally giving way. The past couple of weeks have seen multiple tests of resistance around this area, with lower-lows and lower-highs printing throughout.
EUR/JPY Price Chart: Daily Time-Frame, Build of Lower-Lows, Highs; Resistance at Prior Support
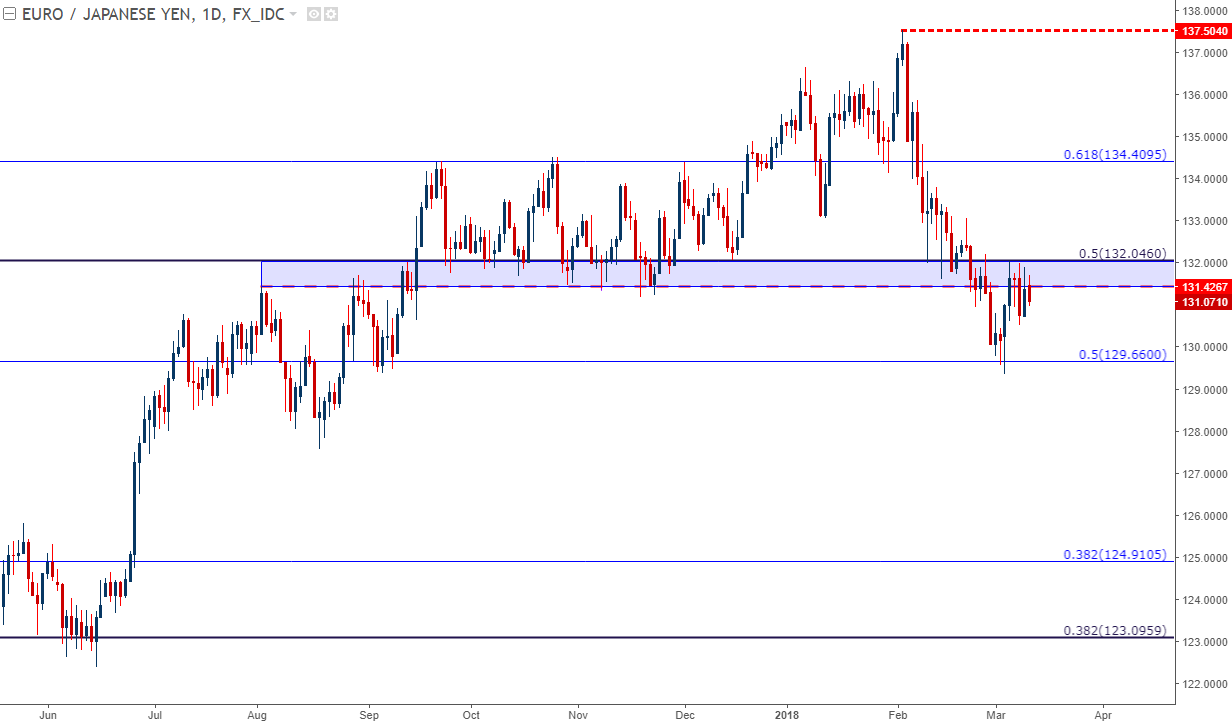
Chart prepared by James Stanley
Forex Trading Resources:
DailyFX offers a plethora of tools, indicators and resources to help traders. For those looking for trading ideas, our IG Client Sentiment shows the positioning of retail traders with actual live trades and positions. Our trading guides bring our DailyFX Quarterly Forecasts and our Top Trading Opportunities; and our real-time news feed has intra-day interactions from the DailyFX team. And if you’re looking for real-time analysis, our DailyFX Webinars offer numerous sessions each week in which you can see how and why we’re looking at what we’re looking at.
If you’re looking for educational information, our New to FX guide is there to help new(er) traders while our Traits of Successful Traders research is built to help sharpen the skill set by focusing on risk and trade management.
--- Written by James Stanley, Strategist for DailyFX.com
To receive James Stanley’s analysis directly via email, please SIGN UP HERE
Contact and follow James on Twitter: @JStanleyFX


