


Talking Points:
- This morning’s Non-Farm Payrolls data out of the United States caps off a busy week in an interesting way. The headline print of +313k crushed the expectation of +205k; but disappointing Average Hourly Earnings has helped to temper any bullish drive in the US Dollar. This highlights the importance of inflation data to near-term USD price action, while the longer-term theme of weakness, driven in-part by fiscal policy in the United States, remains a factor of consideration.
- DXY is testing above the 90.00 level, which has been an area that’s given the currency trouble over the past month, as each test above 90.00 up until now has been soundly faded out of USD. This morning’s move has created some interesting setups in the major pairs of EUR/USD and GBP/USD. EUR/USD is in the process of testing support, while GBP/USD is working on near-term resistance.
- Are you looking to improve your trading approach? Check out Traits of Successful Traders. And if you’re looking for an introductory primer to the Forex market, check out our New to FX Guide.
If you’re looking for longer-term analysis on US Stocks, the Euro or the U.S. Dollar, click here for our Trading Guides.
NFP Headline Prints at +313k, Average Hourly Earnings Disappoints
This morning’s Non-Farm Payrolls data from the month of February blew the doors off, coming in at +313k versus the expectation of +205k. The unemployment rate held steady at 4.1% as the labor force expanded last month; but Average Hourly Earnings came-in at 2.6% versus an expectation of 2.8%. This comes on the heels of last month’s AHE print that was originally released at 2.9%, but that was downgraded this morning to 2.8%.
The net response thus far has been a rather meager move in the US Dollar, with a net bias of weakness. Initially a quick move of weakness was bid back to resistance; but sellers showed up quickly to push prices right back to where we were when everything started. Follow-thru price action appears to be pointing-lower, but this is still extremely early to foretell a continuation of the longer-term theme of weakness in USD; and there are still some significant factors in play around the fiscal side of the US economy at the moment.
US Dollar Price Chart via ‘DXY’: Hourly Time-Frame, Doji Prints Around NFP Release
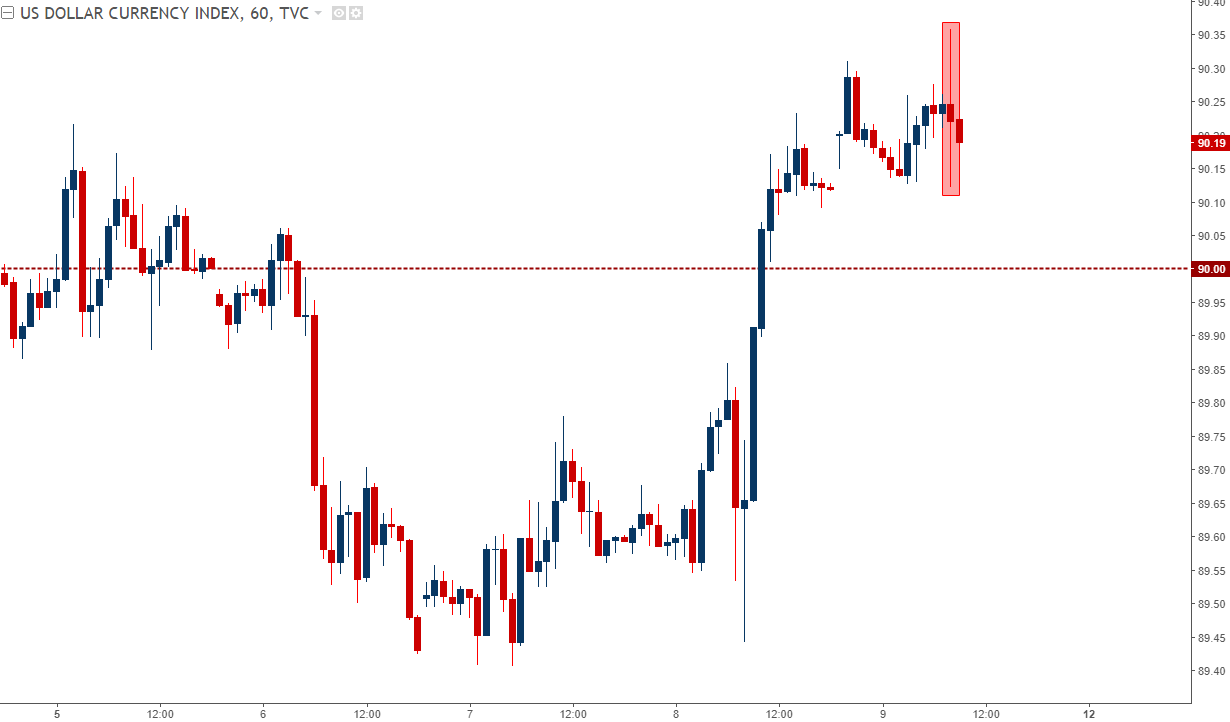
Chart prepared by James Stanley
The fact that there was not a more discernable move of strength highlights the pertinence of inflation data in the United States, particularly in relevance to short-term price action in the US Dollar. Last month saw a spate of strength develop in the Dollar’s year-plus down-trend on the heels of that NFP report, driven in large part by the Average Hourly Earnings portion of that release. But since then, the Dollar has been largely directionless as an expansionary range has developed through February that continues to hold as we move deeper into March.
US Dollar Price Chart via ‘DXY’: Four-Hour Time-Frame, Range-Expansion in February
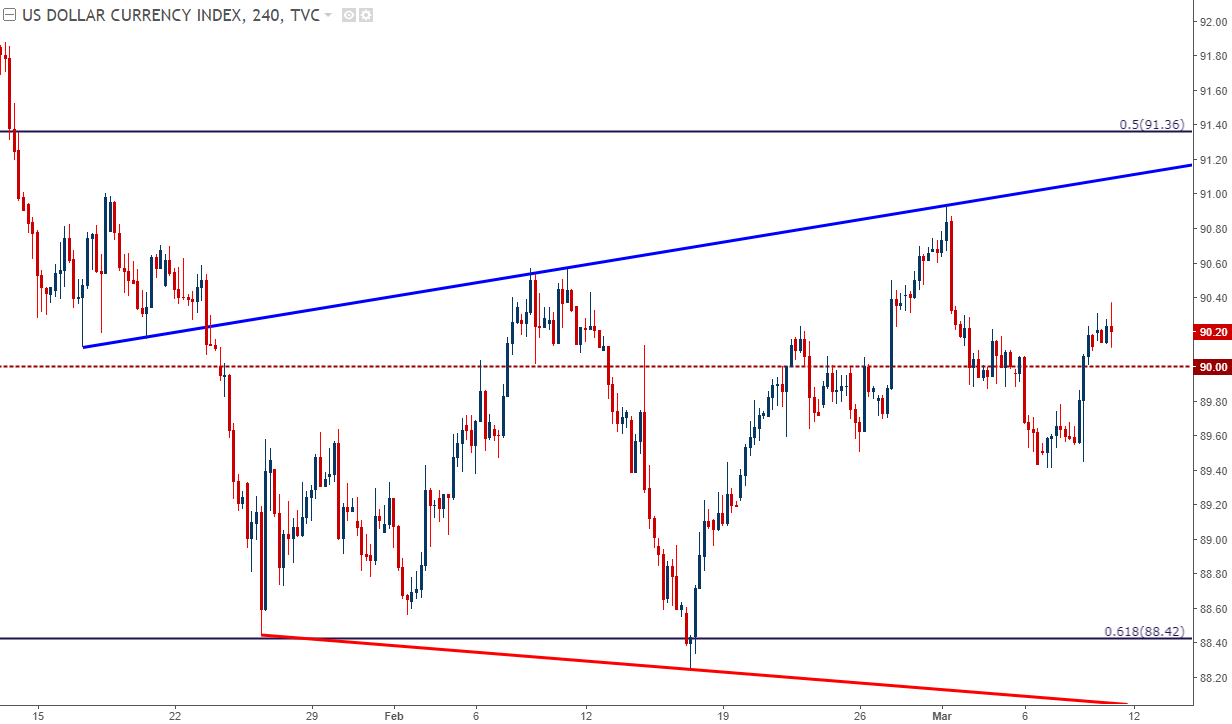
Chart prepared by James Stanley
On a shorter-term basis, the US Dollar has found trouble when trading above the 90.00 level in DXY. Each instance of bullish price action in the Greenback that saw DXY trade above 90.00 last month was soundly faded, and as we open into next week, this remains an item of contention. Notable, however, is how price action in DXY expanded throughout February, offering both a near-term higher-high along with a lower-low; which may be preluding a bigger move, in one direction or the other, as prior support and resistance levels begin to give a bit on each side of the market.
US Inflation Data on Deck – CPI to be Released on Tuesday Morning
Next week brings more data on the US inflation front, as US CPI numbers for the month of February are released on Tuesday morning. US Retail Sales data follows on Wednesday morning, and this is the bulk of the focus around next week’s economic docket. Below, we’re looking at the high-impact events on the DailyFX economic calendar for next week.
DailyFX Economic Calendar: High-Impact Events for Week of March 12, 2018
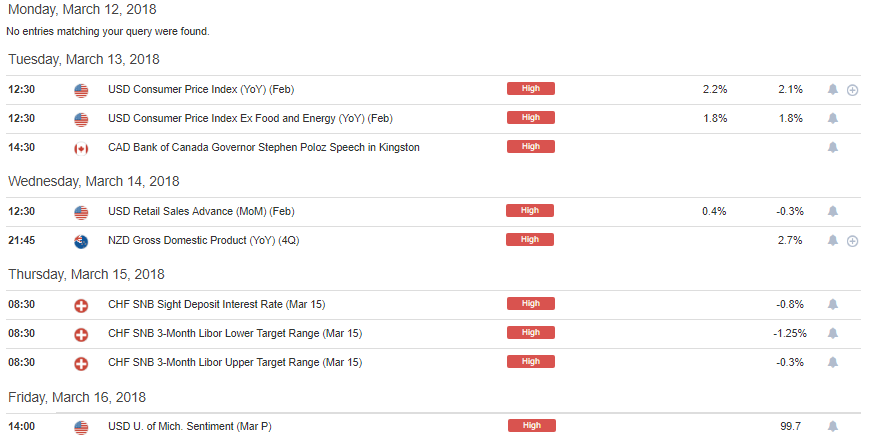
Chart prepared by James Stanley
EUR/USD Drops to Support
On the heels of this morning’s NFP print, EUR/USD has dropped down to a deeper level of support that had showed some relevance in February. This price is around 1.2281, and below that are two more areas of potential support at 1.2213 and 1.2167; the latter of which helped to establish pertinent swing-lows in both January and February. We had looked into this setup in yesterday’s webinar, and while near-term price action remains bearish, the longer-term bullish trend still remains.
EUR/USD Price Chart: Four-Hour Time-Frame, Support Test
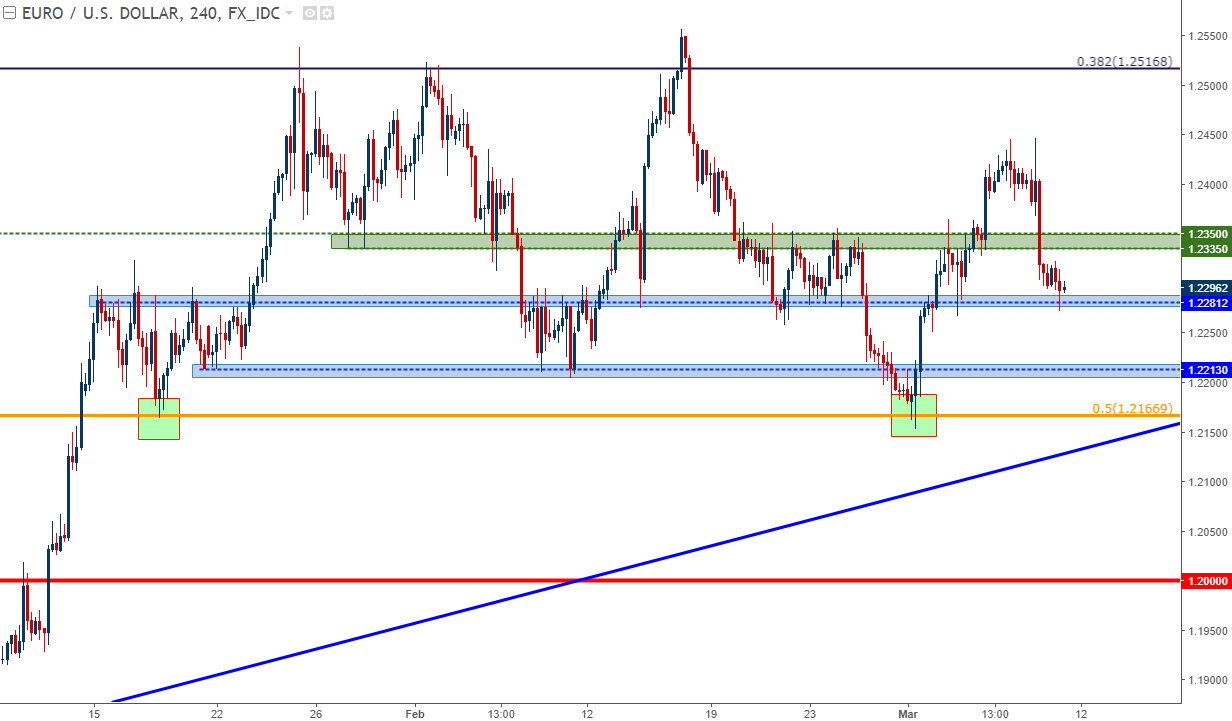
Chart prepared by James Stanley
GBP/USD Tests Resistance
On Wednesday of this week, we looked at the current setup in the British Pound; where a long-term bullish trend is continuing to pull back, keeping the door open for short-term bearish strategies. A bullish trend-line had started to show on the hourly chart, and a bearish break of that trend opens the door for a deeper down-side move. We’re now pulling back to test an area of prior support, around 1.3837 is the 61.8% retracement of the ‘Brexit move’ in the pair. There’s also potential resistance around 1.3860-1.3865 that can keep the door open for short-side stances, looking at stops above the March swing-high of 1.3930.
GBP/USD Price Chart: Four-Hour Time-Frame
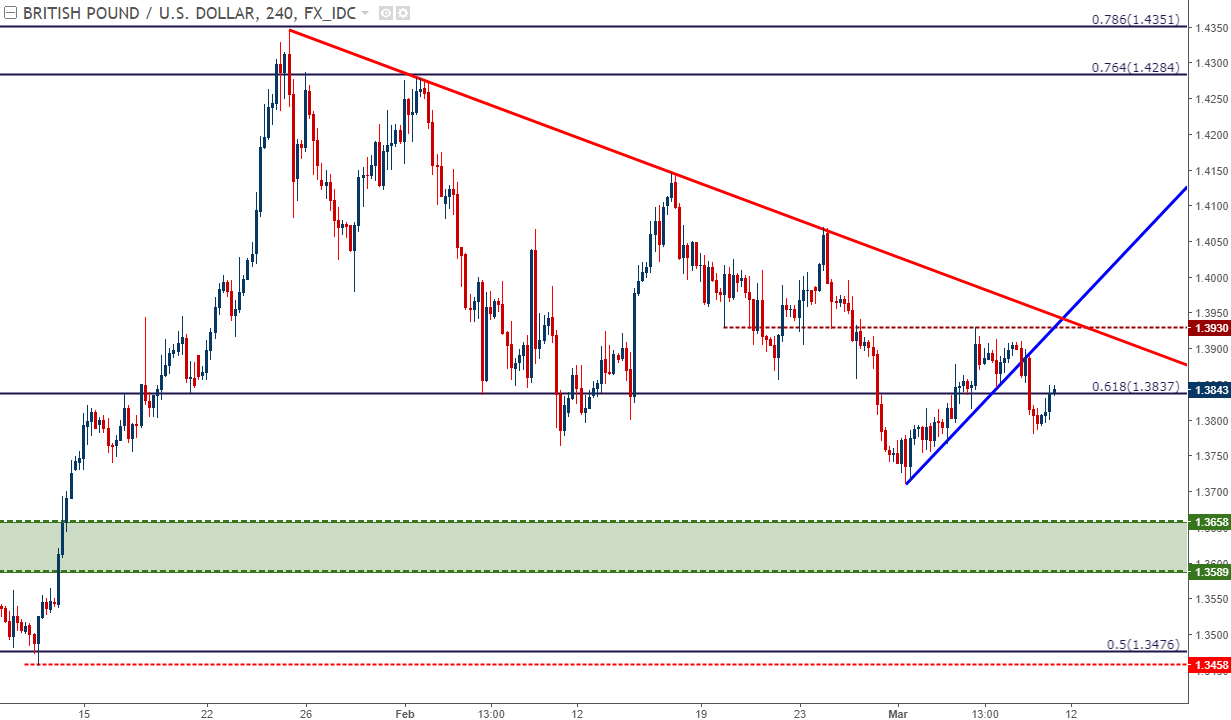
Chart prepared by James Stanley
USD/JPY Support Holds After BoJ
Lost in the headlines this week was a Bank of Japan meeting that happened last night. Nothing actually ‘happened’ as was widely expected, no changes were made to policy nor were any warnings of taper or stimulus exit offered. BoJ Governor Kuroda was able to reduce fears that the BoJ might be forced away from their massive QE program, and USD/JPY continues to hold support on a symmetrical wedge formation that’s been building for a few years now.
USD/JPY Weekly Chart: Wedge, Fibonacci Support Holds the Lows of 2018 Down-Trend
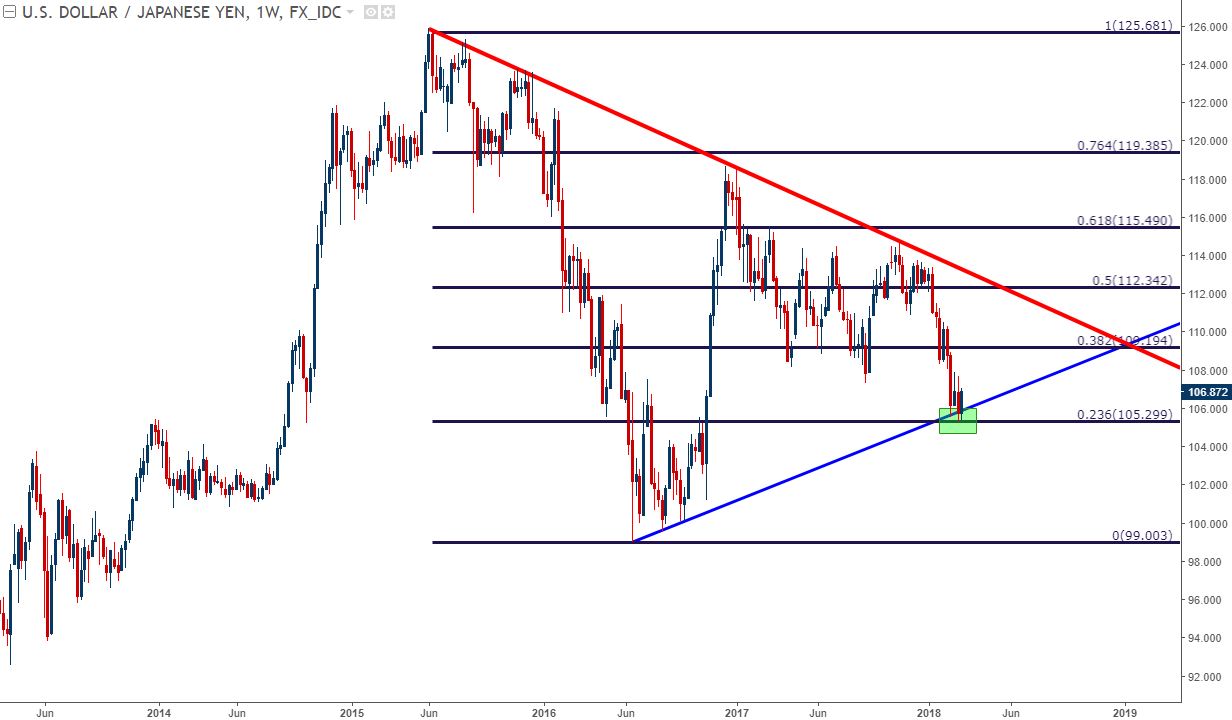
Chart prepared by James Stanley
This opens the door for an interesting zone of potential resistance between the prices of 107.83-108.27. This is an area of prior swing-support, and if we do see sellers around this zone, strategies targeting a re-test of lows and, perhaps even a downside break of this longer-term support can become attractive.
USD/JPY Price Chart: Daily Time-Frame, Resistance Potential 107.83-108.27
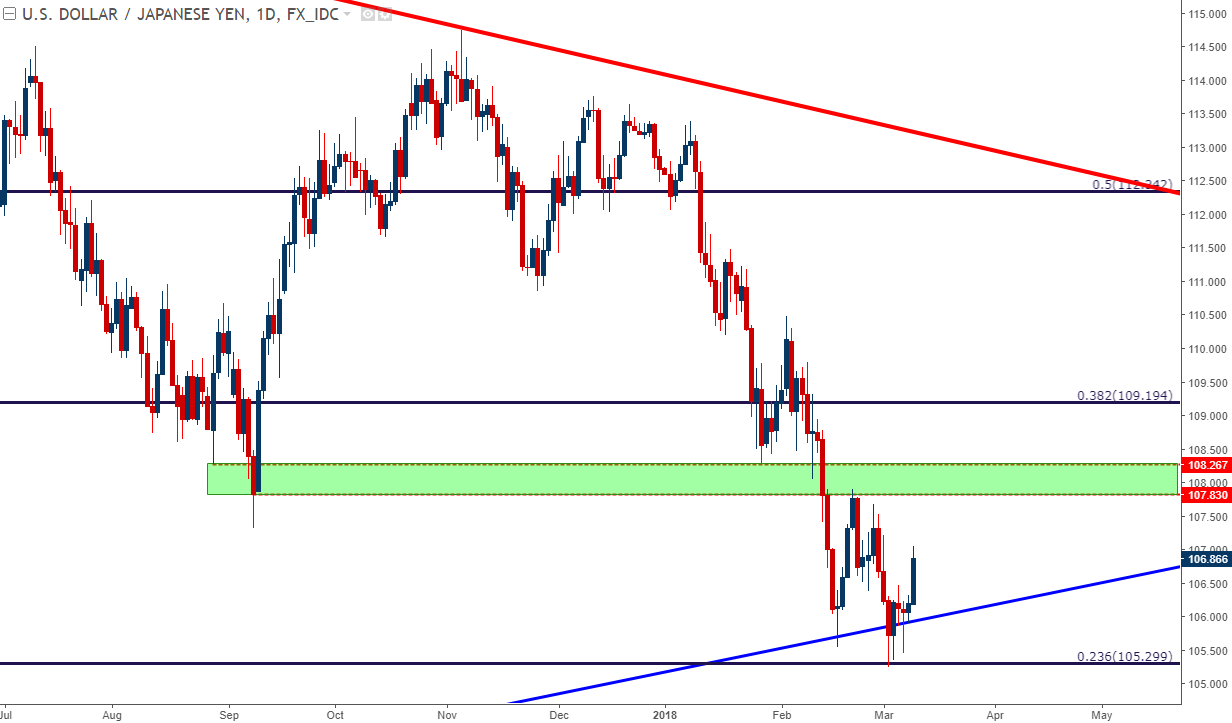
Chart prepared by James Stanley
To read more:
Are you looking for longer-term analysis on the Euro, the British Pound or the U.S. Dollar? Our DailyFX Forecasts for Q1 have a section for each major currency, and we also offer a plethora of resources on our EUR/USD, GBP/USD, USD/JPY, AUD/USD and U.S. Dollar pages. Traders can also stay up with near-term positioning via our IG Client Sentiment Indicator.
--- Written by James Stanley, Strategist for DailyFX.com
To receive James Stanley’s analysis directly via email, please SIGN UP HERE
Contact and follow James on Twitter: @JStanleyFX


