


Euro Forecast Overview:
- As the DXY Index has clawed back gains in recent weeks, EUR/USD rates have slid back. Similarly, weakness in equity markets has seen EUR/JPY rates drop. Their collective fates remain intertwined.
- Although EUR/USD rates remain stuck in their bull flag, EUR/JPY rates have recent rallied off of former resistance, validating a critical area as support at an opportune time.
- Per the IG Client Sentiment Index, the Euro has a mixed if not bullish bias.

Euro Decline Stalls, Turn Beginning?
The Euro reversal in recent days has gone hand-in-hand with a deterioration in not only the broader DXY Index, but with a rise in equity markets as well. This comes after weeks after the exact opposite scenario playing out: a strong US Dollar, a weak Euro, and weak price action in stocks. On one hand, US Dollar strength on diminished fiscal stimulus hopes, fueling a rise in US real yields, is much to blame. However, Euro weakness has its own roots, beyond that of the otherwise commanding US Dollar narrative.
As Eurozone Data Erodes, ECB Rate Cut Expectations Inch Higher
Quietly since the middle of August, there has been backdrop of steadily deteriorating economic data coming out of the Eurozone. In tandem, European Central Bank interest rate expectations have started to inch higher, suggesting that an interest rate cut deeper into negative territory will arrive sooner in the first half of 2021 than previously anticipated.
In context of recent COVID-19 outbreaks appearing in and around major urban centers in Europe, the decline in economic data performance relative to expectations is both a mix of disappointment and analysts simply getting better adept at judging the economy in the coronavirus pandemic era. The Citi Economic Surprise Index for the Eurozone, a gauge of economic data momentum, currently sits at 41.8 today, down from its high of the year set on August11 at 212.40.
EUROPEAN CENTRAL BANK INTEREST RATE EXPECTATIONS (September 28, 2020) (CHART 1)
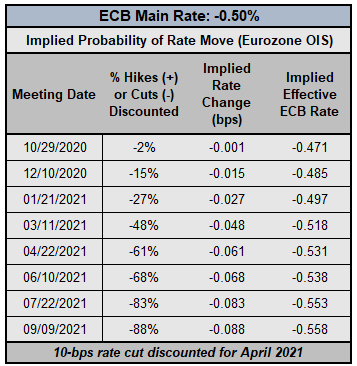
According to Eurozone overnight index swaps, there is only a 15% chance of a 10-bps interest rate cut by the end of 2020. But interest rate cut odds have been pulled forward in recent weeks: in mid-August, OIS pricing favored June 2021 with 54% odds for the next rate move. Now, as the third quarter comes to a close, April 2021 is favored with an implied probability of 61%.
EUR/USD RATE TECHNICAL ANALYSIS: WEEKLY CHART (November 2016 to August 2020) (CHART 1)
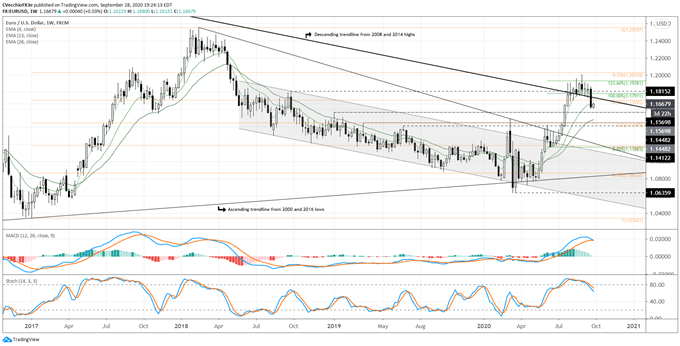
EUR/USD rates have fallen back significantly after barely falling short of reaching the 23.6% Fibonacci retracement of the 2017 low/2018 high range (as indicated by the orange Fibs in Charts 1 & 2); EUR/USD has fallen back below the 38.2% Fibonacci retracement now too, which comes in at 1.1709. Concurrently, EUR/USD rates have moved below the descending trendline from the 2008 and 2014 highs, which remains nearby around 1.1725 this week.
While EUR/USD rates are holding at their weekly 13-EMA, they remain below the 4-EMA and above the 26-EMA envelope. Weekly MACD is falling back in bullish territory, while Slow Stochastics have slipped from overbought territory. Significant technical damage has been done, and the threat of a failed bullish breakout having developed in August and September is very possible.
EUR/USD RATE TECHNICAL ANALYSIS: DAILY CHART (September 2019 to September 2020) (CHART 2)
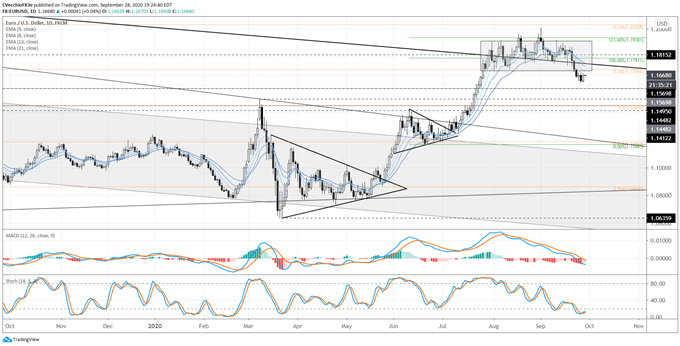
The daily chart tells a potentially equally ominous story as the weekly chart, with concern in the form of a head and shoulders pattern). EUR/USD rates are holding below their daily 5-, 8-, 13-, and 21-EMA envelope, which is in bearish sequential order. Daily MACD has declined below its signal line into bearish territory, and Slow Stochastics are holding in oversold condition. Failure to retake the 38.2% Fibonacci retracement of the 2017 low/2018 high range at 1.1709 before setting a new low relative to last week would suggesting continuation lower.
IG Client Sentiment Index: EUR/USD Rate Forecast (September 28, 2020) (Chart 3)
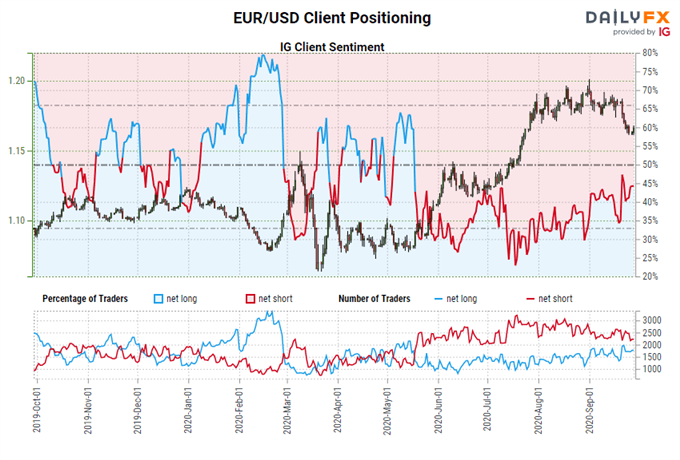
EUR/USD: Retail trader data shows 43.72% of traders are net-long with the ratio of traders short to long at 1.29 to 1. The number of traders net-long is 4.85% higher than yesterday and 5.76% lower from last week, while the number of traders net-short is 8.07% higher than yesterday and 12.49% higher from last week.
We typically take a contrarian view to crowd sentiment, and the fact traders are net-short suggests EUR/USD prices may continue to rise.
Traders are further net-short than yesterday and last week, and the combination of current sentiment and recent changes gives us a stronger EUR/USD-bullish contrarian trading bias.
EUR/JPY RATE TECHNICAL ANALYSIS: DAILY CHART (September 2019 to September 2020) (CHART 4)
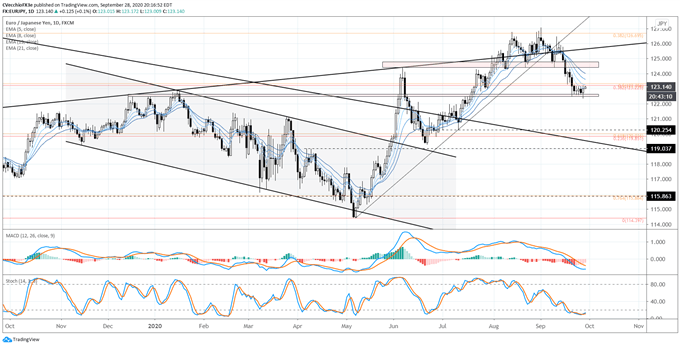
After hitting the 38.2% Fibonacci retracement of the 2018 high/2020 low range at 126.70, EUR/JPY rates meandered sideways for a few weeks before failing below the rising trendline from the May and July swing lows – the coronavirus pandemic trendline. But more importantly, EUR/JPY rates had dropped back below the uptrend from the September 2012, September 2016, and January 2019 swing lows – a clear bearish signal.
That said, EUR/JPY rates have recently found support in familiar territory, where the December 2019 highs were carved out after returning to the uptrend from the September 2012, September 2016, and January 2019 swing lows. For now, EUR/JPY rates are above their daily 5-EMA, but below the remainder of the daily 5-, 8-, 13-, and 21-EMA envelope, which is in bearish sequential order otherwise. Clearing the Fibonacci retracement cluster zone around 123.23/36 would give greater confidence in a near-term rebound higher.
IG Client Sentiment Index: EUR/JPY Rate Forecast (September 28, 2020) (Chart 5)
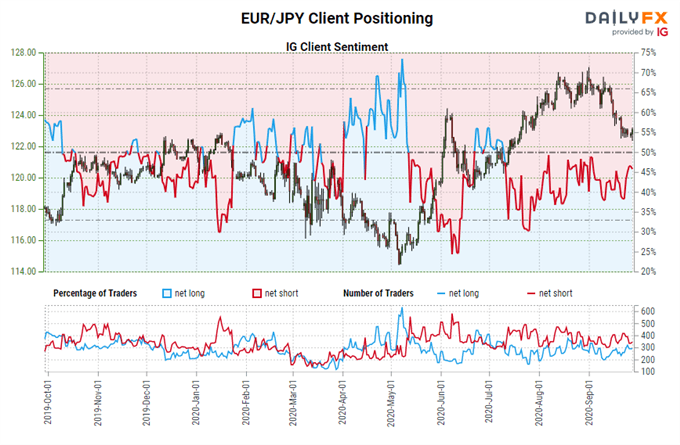
EUR/JPY: Retail trader data shows 44.18% of traders are net-long with the ratio of traders short to long at 1.26 to 1. The number of traders net-long is 0.68% lower than yesterday and 22.69% higher from last week, while the number of traders net-short is 6.03% higher than yesterday and 13.19% higher from last week.
We typically take a contrarian view to crowd sentiment, and the fact traders are net-short suggests EUR/JPY prices may continue to rise.
Positioning is more net-short than yesterday but less net-short from last week. The combination of current sentiment and recent changes gives us a further mixed EUR/JPY trading bias.
--- Written by Christopher Vecchio, CFA, Senior Currency Strategist


