


Top FX Headlines Talking Points:
- The Euro saw a bout of weakness at the end of August and at the start of September with fresh yearly lows coming into play versus the Japanese Yen and US Dollar.
- However, it may be the case that markets have gone ‘too far, too fast’ – there is now a 57% chance of a 20-bps rate cut at the September ECB meeting; a 10-bps rate cut remains 100% priced-in.
- The IG Client Sentiment Index suggest that EURJPY may rebound while the outlook for EURUSD is mixed.
Looking for longer-term forecasts on the British Pound? Check out the DailyFX Trading Guides.
The Euro saw a bout of weakness at the end of August and at the start of September with fresh yearly lows coming into play versus the Japanese Yen and US Dollar. Much of this was spurred on by comments made from incoming European Central Bank President Christine Lagarde, who last week signaled that she was willing to take the ECB’s interest rates deep into negative territory to stimulate growth.
In turn, interest rate markets have aggressively priced-in a more dovish ECB moving forward. The juxtaposition of retreating Fed rate cut odds and rising ECB rate cut odds has proven negative for EURUSD, and in turn, other EUR-crosses associated with risk like EURJPY. But we may be at an extreme: it stress credulity to believe that rates markets will become any more aggressive from here, given the lay of recent economic data.
Read more: Negative Yielding Government Bonds – What Are They Telling Us?
Eurozone Economic Data Still Disappointing
The past several weeks have seem Eurozone economic data improve, relatively speaking, at least when trying to take a look the lay of the economic land from an objective point of view. The Citi Economic Surprise Index for the Eurozone, a gauge of economic data momentum, is currently at -31.8; one month ago, it was at -53.3.
Eurozone Inflation Expectations versus Brent Oil Prices: Daily Timeframe (September 2018 to September 2019) (Chart 1)

Outgoing ECB President Mario Draghi’s preferred measure of inflation, the 5y5y inflation swap forwards, are currently trading at 1.205%, higher than where they were one month earlier at 1.186%, and still significantly above the yearly low set on June 17 at 1.141%. While these are market readings that will reinforce speculation for more easing from the ECB soon, they don’t necessarily scream for a ‘steep’ 20-bps rate cut in September.
ECB Rate Cut Cycle to Restart at September ECB Meeting
The ECB will cut interest rates in September – that much is certain, at least according to interest rate markets. Overnight index swaps are currently pricing a 100% chance of a 10-bps rate cut. But there is a high degree of certainty that the ECB will move to cut rates deeper than that when they meet on September 12.
European Central Bank Interest Rate Expectations (September 4, 2019) (Table 1)

Overnight index swaps are currently pricing in a 57% chance of a 20-bps rate cut at the September ECB meeting. If not, there is a 66% chance of a second 10-bps rate cut coming in October, while there is an 85% chance of the second 10-bps of rate cut at the December ECB meeting. Rates markets are pricing a third rate cut over the next 12-months coming in January 2020. Rate cut expectations are frontloaded and a simple retracement of the aggressive pricing may give the Euro some room to breathe in the short-term.
EURUSD TECHNICAL ANALYSIS: DAILY RATE CHART (MAY 2018 TO September 2019) (CHART 2)

In our last EURUSD technical forecast update, it was noted that “traders should not be focusing on topside potential, instead, on downside potential.The EURUSD symmetrical triangle that’s been forming since mid-July is now seeing support from the August 1 and August 23 lows come into focus near 1.1060. Price is now below the daily 8-, 13-, and 21-EMA envelope, while daily MACD and Slow Stochastics have turned lower in bearish territory. The August 23 bullish key reversal/outside engulfing bar low comes into play at 1.1052; below here, then a bearish breakout may be afoot.”
The bearish triangle breakout took place, with EURUSD hitting a fresh yearly low at 1.0926 on Tuesday, September 3. But the area where EURUSD rates found support is familiar: channel support dating back to the August and November 2018 lows. Similarly, the descending trendline from the January and April 2019 swing highs is proving as support as well.
If ECB rate cut odds are topping out, then there may be room for EURUSD to run higher from these key support regions. EURUSD remains below the daily 8-, 13-, and 21-EMA envelope, a clear sign that bearish momentum has been firm. Daily MACD remains pointed lower in bearish territory; while Slow Stochastics are rising, but are just coming out of oversold territory. If the EURUSD reversal is going to gather pace, traders may want to see rates breach the August 23 bullish outside engulfing low at 1.1028.
IG Client Sentiment Index: EURUSD RATE Forecast (September 4, 2019) (Chart 3)

EURUSD: Retail trader data shows 69.9% of traders are net-long with the ratio of traders long to short at 2.32 to 1. In fact, traders have remained net-long since July 1 when EURUSD traded near 1.1374; price has moved 3.0% lower since then. The number of traders net-long is 5.3% lower than yesterday and 5.9% higher from last week, while the number of traders net-short is 7.2% higher than yesterday and 9.9% lower from last week.
We typically take a contrarian view to crowd sentiment, and the fact traders are net-long suggests EURUSD prices may continue to fall. Positioning is less net-long than yesterday but more net-long from last week. The combination of current sentiment and recent changes gives us a further mixed EURUSD trading bias.
EURJPY TECHNICAL ANALYSIS: WEEKLY RATE CHART (2008 TO 2019) (CHART 4)
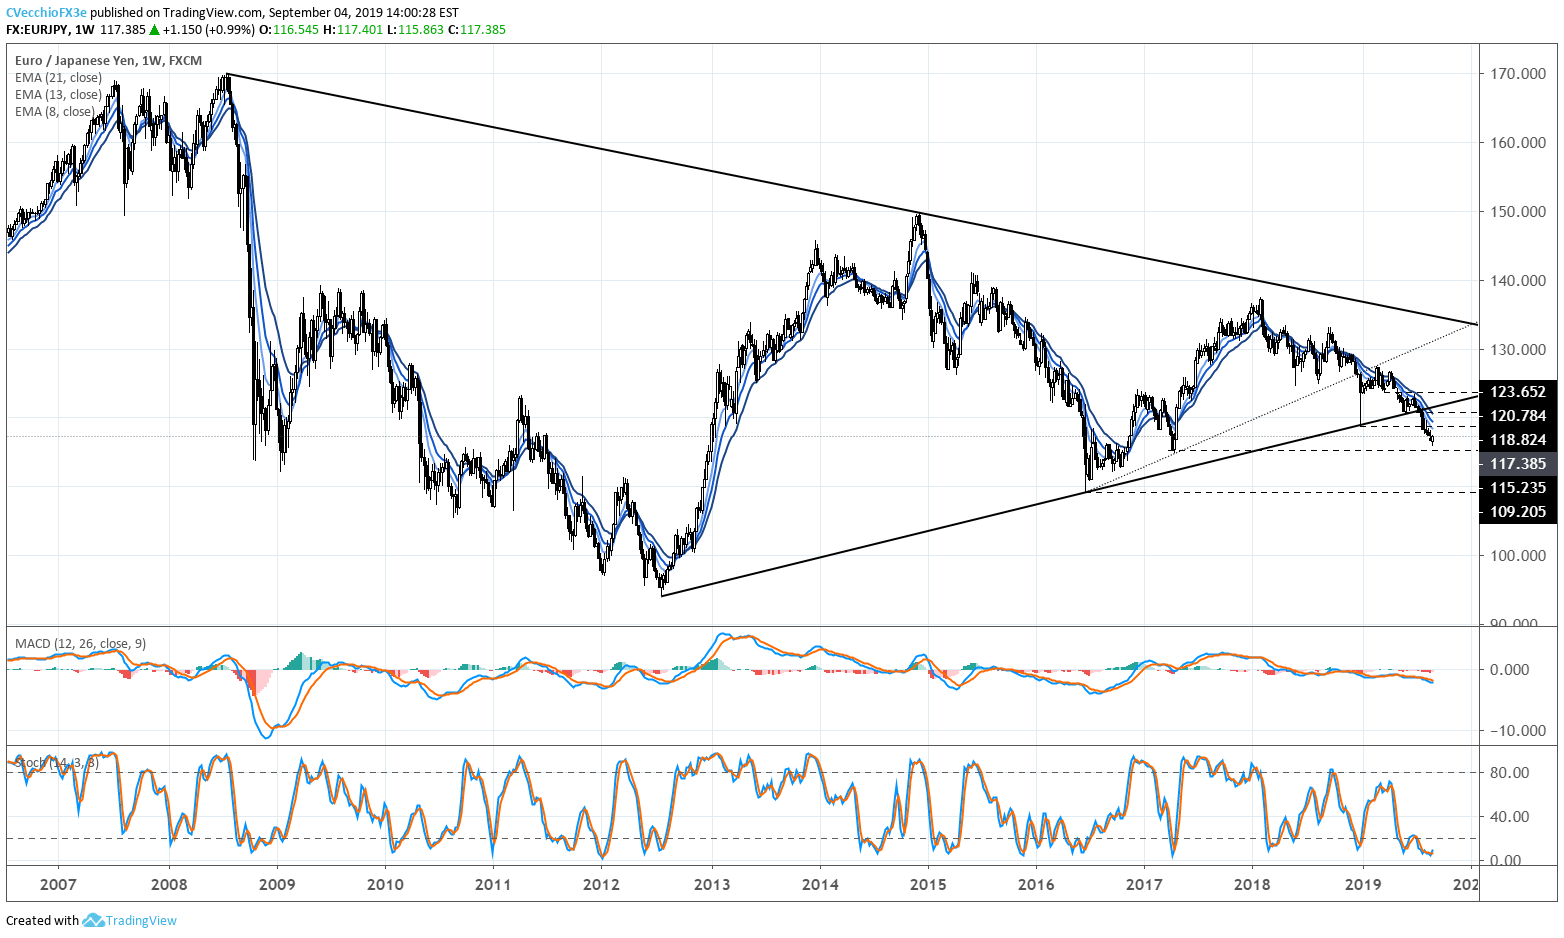
Big picture: we may be witnessing the early phases of what could be a long-term downtrend for EURJPY with the weekly timeframe suggesting a loss of triangle support from the 2012 and 2016 lows and recent swing support at the January 2019 Japanese Yen flash-crash low at 118.82.
EURJPY TECHNICAL ANALYSIS: DAILY RATE CHART (FEBRUARY 2017 TO September 2019) (CHART 5)
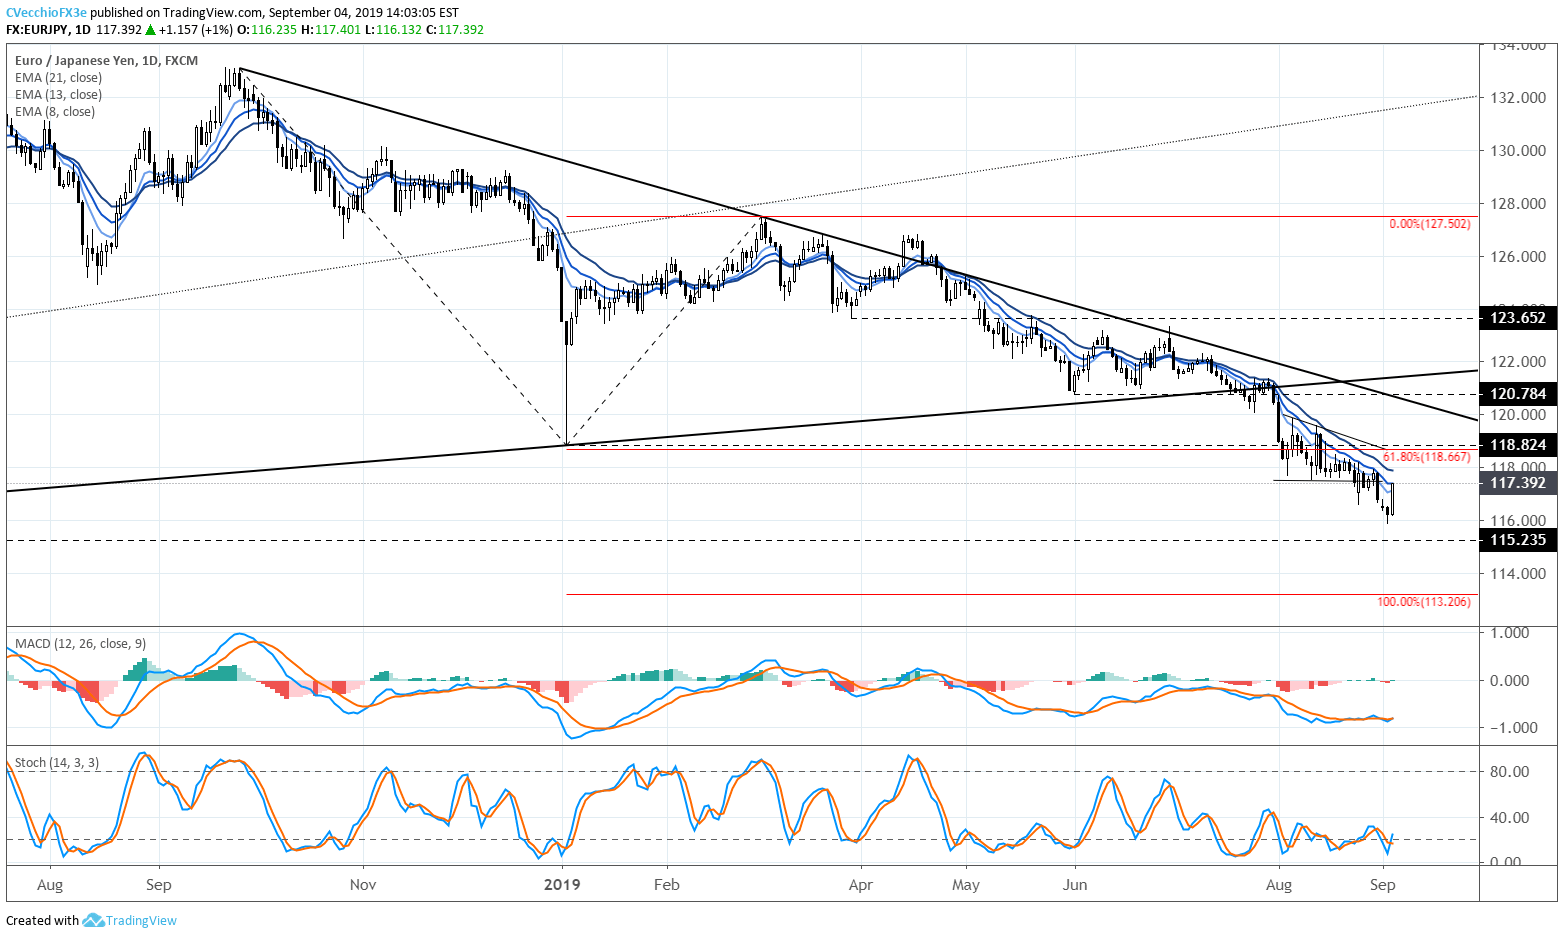
In our last EURJPY technical forecast update, it was noted that “the lack of follow through in the bearish breakout has seen momentum indicators like daily MACD and Slow Stochastics turn higher, albeit holding in bearish territories…the 100% Fibonacci extension of the September 2018 high to January 2019 low to March 2019 high move comes in at 113.21, which looks increasingly in playthe longer that EURJPY spends below the 61.8% Fibonacci extension at 118.67.”
The drop by EURJPY didn’t quite reach that far, with a fresh yearly low coming in on Tuesday, September 3 at 115.86. But the scope of the reversal today speaks to potential for a greater reversal, particularly if the daily 8-, 13-, and 21-EMA envelope is broke to the topside: rates have closed below the daily 21-EMA every session since July 12. With daily MACD and Slow Stochastics starting to turn higher in bearish territory, a move above the daily 21-EMA would suggest a more significant EURJPY bottoming effort is afoot.
IG Client Sentiment Index: EURJPY Rate Forecast (September 4, 2019) (Chart 6)

EURJPY: Retail trader data shows 62.8% of traders are net-long with the ratio of traders long to short at 1.69 to 1. In fact, traders have remained net-long since April 25 when EURJPY traded near 125.27; price has moved 6.5% lower since then. The number of traders net-long is 7.9% lower than yesterday and 8.9% lower from last week, while the number of traders net-short is 6.2% lower than yesterday and 8.0% lower from last week.
We typically take a contrarian view to crowd sentiment, and the fact traders are net-long suggests EURJPY prices may continue to fall. Yet traders are less net-long than yesterday and compared with last week. Recent changes in sentiment warn that the current EURJPY price trend may soon reverse higher despite the fact traders remain net-long.
FX TRADING RESOURCES
Whether you are a new or experienced trader, DailyFX has multiple resources available to help you: an indicator for monitoring trader sentiment; quarterly trading forecasts; analytical and educational webinars held daily; trading guides to help you improve trading performance, and even one for those who are new to FX trading.
--- Written by Christopher Vecchio, CFA, Senior Currency Strategist
To contact Christopher Vecchio, e-mail at cvecchio@dailyfx.com
Follow him on Twitter at @CVecchioFX
View our long-term forecasts with the DailyFX Trading Guides


